Yuman vs Immigrants from Poland No Schooling Completed
COMPARE
Yuman
Immigrants from Poland
No Schooling Completed
No Schooling Completed Comparison
Yuman
Immigrants from Poland
2.5%
NO SCHOOLING COMPLETED
0.4/ 100
METRIC RATING
267th/ 347
METRIC RANK
2.1%
NO SCHOOLING COMPLETED
55.2/ 100
METRIC RATING
171st/ 347
METRIC RANK
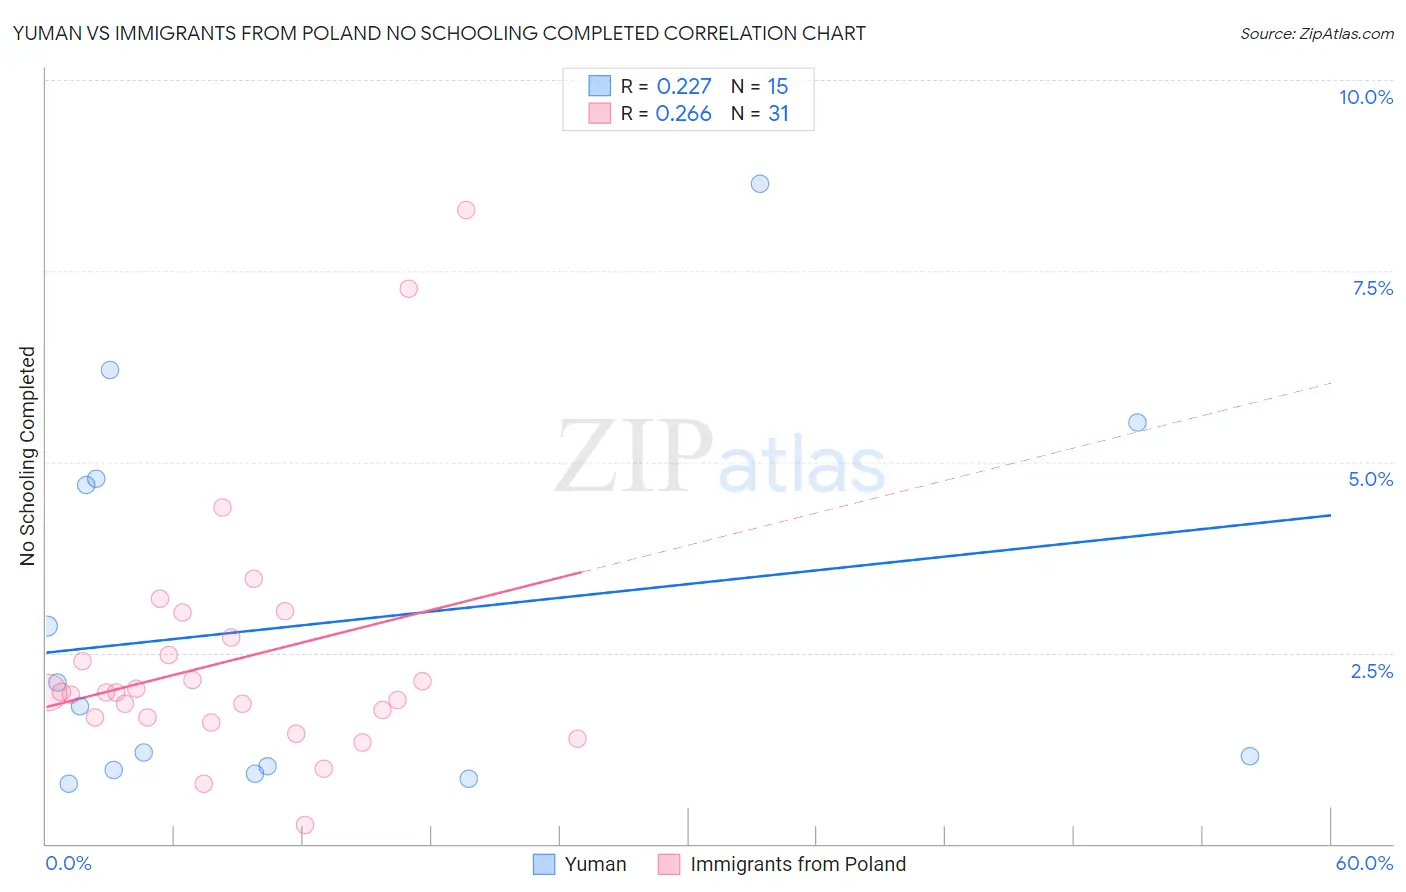
Yuman vs Immigrants from Poland No Schooling Completed Correlation Chart
The statistical analysis conducted on geographies consisting of 40,618,798 people shows a weak positive correlation between the proportion of Yuman and percentage of population with no schooling in the United States with a correlation coefficient (R) of 0.227 and weighted average of 2.5%. Similarly, the statistical analysis conducted on geographies consisting of 302,129,066 people shows a weak positive correlation between the proportion of Immigrants from Poland and percentage of population with no schooling in the United States with a correlation coefficient (R) of 0.266 and weighted average of 2.1%, a difference of 19.7%.
No Schooling Completed Correlation Summary
| Measurement | Yuman | Immigrants from Poland |
| Minimum | 0.78% | 0.25% |
| Maximum | 8.6% | 8.3% |
| Range | 7.9% | 8.0% |
| Mean | 2.9% | 2.4% |
| Median | 1.8% | 2.0% |
| Interquartile 25% (IQ1) | 0.96% | 1.6% |
| Interquartile 75% (IQ3) | 4.8% | 2.7% |
| Interquartile Range (IQR) | 3.8% | 1.0% |
| Standard Deviation (Sample) | 2.5% | 1.7% |
| Standard Deviation (Population) | 2.4% | 1.6% |
Similar Demographics by No Schooling Completed
Demographics Similar to Yuman by No Schooling Completed
In terms of no schooling completed, the demographic groups most similar to Yuman are Fijian (2.5%, a difference of 0.17%), West Indian (2.5%, a difference of 0.25%), Taiwanese (2.5%, a difference of 0.26%), Indian (Asian) (2.5%, a difference of 0.43%), and Immigrants from Liberia (2.5%, a difference of 0.56%).
| Demographics | Rating | Rank | No Schooling Completed |
| Immigrants | Ethiopia | 0.6 /100 | #260 | Tragic 2.5% |
| Armenians | 0.5 /100 | #261 | Tragic 2.5% |
| Immigrants | Sierra Leone | 0.5 /100 | #262 | Tragic 2.5% |
| Immigrants | Liberia | 0.4 /100 | #263 | Tragic 2.5% |
| Indians (Asian) | 0.4 /100 | #264 | Tragic 2.5% |
| West Indians | 0.4 /100 | #265 | Tragic 2.5% |
| Fijians | 0.4 /100 | #266 | Tragic 2.5% |
| Yuman | 0.4 /100 | #267 | Tragic 2.5% |
| Taiwanese | 0.3 /100 | #268 | Tragic 2.5% |
| Immigrants | Nigeria | 0.2 /100 | #269 | Tragic 2.5% |
| Immigrants | Peru | 0.2 /100 | #270 | Tragic 2.5% |
| Cubans | 0.2 /100 | #271 | Tragic 2.5% |
| Immigrants | Bolivia | 0.2 /100 | #272 | Tragic 2.5% |
| Immigrants | Cameroon | 0.1 /100 | #273 | Tragic 2.5% |
| Ghanaians | 0.1 /100 | #274 | Tragic 2.6% |
Demographics Similar to Immigrants from Poland by No Schooling Completed
In terms of no schooling completed, the demographic groups most similar to Immigrants from Poland are Argentinean (2.1%, a difference of 0.11%), Apache (2.1%, a difference of 0.20%), Immigrants from Argentina (2.1%, a difference of 0.33%), Immigrants from Belarus (2.1%, a difference of 0.46%), and Cheyenne (2.1%, a difference of 0.47%).
| Demographics | Rating | Rank | No Schooling Completed |
| Comanche | 60.7 /100 | #164 | Good 2.1% |
| Brazilians | 60.2 /100 | #165 | Good 2.1% |
| Dutch West Indians | 59.9 /100 | #166 | Average 2.1% |
| Egyptians | 59.2 /100 | #167 | Average 2.1% |
| Cheyenne | 58.6 /100 | #168 | Average 2.1% |
| Apache | 56.7 /100 | #169 | Average 2.1% |
| Argentineans | 56.0 /100 | #170 | Average 2.1% |
| Immigrants | Poland | 55.2 /100 | #171 | Average 2.1% |
| Immigrants | Argentina | 52.7 /100 | #172 | Average 2.1% |
| Immigrants | Belarus | 51.8 /100 | #173 | Average 2.1% |
| Immigrants | Micronesia | 50.0 /100 | #174 | Average 2.1% |
| Arabs | 46.4 /100 | #175 | Average 2.1% |
| Panamanians | 45.2 /100 | #176 | Average 2.1% |
| Arapaho | 45.0 /100 | #177 | Average 2.1% |
| Pakistanis | 44.7 /100 | #178 | Average 2.1% |