Afghan vs Immigrants from Southern Europe Single Mother Households
COMPARE
Afghan
Immigrants from Southern Europe
Single Mother Households
Single Mother Households Comparison
Afghans
Immigrants from Southern Europe
6.3%
SINGLE MOTHER HOUSEHOLDS
52.5/ 100
METRIC RATING
171st/ 347
METRIC RANK
6.1%
SINGLE MOTHER HOUSEHOLDS
80.5/ 100
METRIC RATING
151st/ 347
METRIC RANK
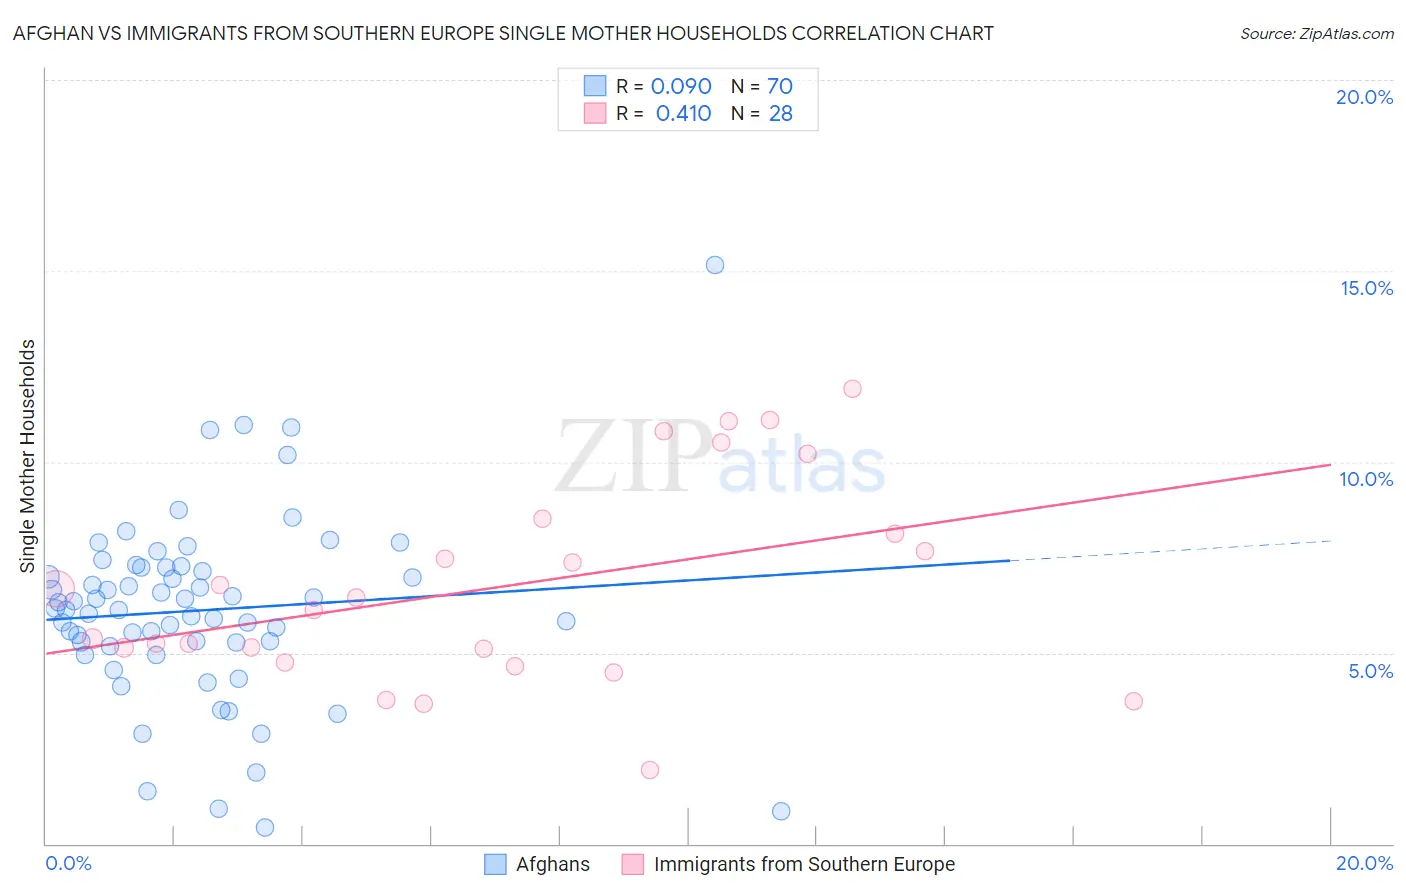
Afghan vs Immigrants from Southern Europe Single Mother Households Correlation Chart
The statistical analysis conducted on geographies consisting of 148,722,502 people shows a slight positive correlation between the proportion of Afghans and percentage of single mother households in the United States with a correlation coefficient (R) of 0.090 and weighted average of 6.3%. Similarly, the statistical analysis conducted on geographies consisting of 401,370,975 people shows a moderate positive correlation between the proportion of Immigrants from Southern Europe and percentage of single mother households in the United States with a correlation coefficient (R) of 0.410 and weighted average of 6.1%, a difference of 3.7%.
Single Mother Households Correlation Summary
| Measurement | Afghan | Immigrants from Southern Europe |
| Minimum | 0.41% | 1.9% |
| Maximum | 15.1% | 11.9% |
| Range | 14.7% | 10.0% |
| Mean | 6.1% | 6.7% |
| Median | 6.1% | 6.3% |
| Interquartile 25% (IQ1) | 5.3% | 4.9% |
| Interquartile 75% (IQ3) | 7.2% | 8.3% |
| Interquartile Range (IQR) | 2.0% | 3.4% |
| Standard Deviation (Sample) | 2.4% | 2.7% |
| Standard Deviation (Population) | 2.4% | 2.6% |
Demographics Similar to Afghans and Immigrants from Southern Europe by Single Mother Households
In terms of single mother households, the demographic groups most similar to Afghans are Immigrants from Oceania (6.3%, a difference of 0.23%), Puget Sound Salish (6.3%, a difference of 0.63%), Immigrants from Chile (6.3%, a difference of 0.65%), Brazilian (6.2%, a difference of 0.74%), and Sri Lankan (6.2%, a difference of 1.3%). Similarly, the demographic groups most similar to Immigrants from Southern Europe are Pakistani (6.1%, a difference of 0.23%), Immigrants from Brazil (6.1%, a difference of 0.27%), Immigrants from Philippines (6.1%, a difference of 0.34%), White/Caucasian (6.1%, a difference of 0.67%), and Native Hawaiian (6.1%, a difference of 0.90%).
| Demographics | Rating | Rank | Single Mother Households |
| Immigrants | Southern Europe | 80.5 /100 | #151 | Excellent 6.1% |
| Pakistanis | 79.2 /100 | #152 | Good 6.1% |
| Immigrants | Brazil | 78.9 /100 | #153 | Good 6.1% |
| Immigrants | Philippines | 78.5 /100 | #154 | Good 6.1% |
| Whites/Caucasians | 76.5 /100 | #155 | Good 6.1% |
| Native Hawaiians | 75.0 /100 | #156 | Good 6.1% |
| Chileans | 74.2 /100 | #157 | Good 6.1% |
| Celtics | 73.3 /100 | #158 | Good 6.1% |
| Yugoslavians | 73.1 /100 | #159 | Good 6.1% |
| Iraqis | 73.0 /100 | #160 | Good 6.1% |
| Immigrants | Germany | 72.4 /100 | #161 | Good 6.1% |
| Immigrants | Zimbabwe | 69.9 /100 | #162 | Good 6.2% |
| Alsatians | 68.7 /100 | #163 | Good 6.2% |
| Immigrants | Northern Africa | 68.0 /100 | #164 | Good 6.2% |
| Immigrants | Syria | 67.4 /100 | #165 | Good 6.2% |
| Sri Lankans | 63.9 /100 | #166 | Good 6.2% |
| Brazilians | 59.1 /100 | #167 | Average 6.2% |
| Immigrants | Chile | 58.3 /100 | #168 | Average 6.3% |
| Puget Sound Salish | 58.1 /100 | #169 | Average 6.3% |
| Immigrants | Oceania | 54.6 /100 | #170 | Average 6.3% |
| Afghans | 52.5 /100 | #171 | Average 6.3% |