Aleut vs Immigrants from Bulgaria Family Households
COMPARE
Aleut
Immigrants from Bulgaria
Family Households
Family Households Comparison
Aleuts
Immigrants from Bulgaria
63.4%
FAMILY HOUSEHOLDS
1.9/ 100
METRIC RATING
239th/ 347
METRIC RANK
63.0%
FAMILY HOUSEHOLDS
0.2/ 100
METRIC RATING
280th/ 347
METRIC RANK
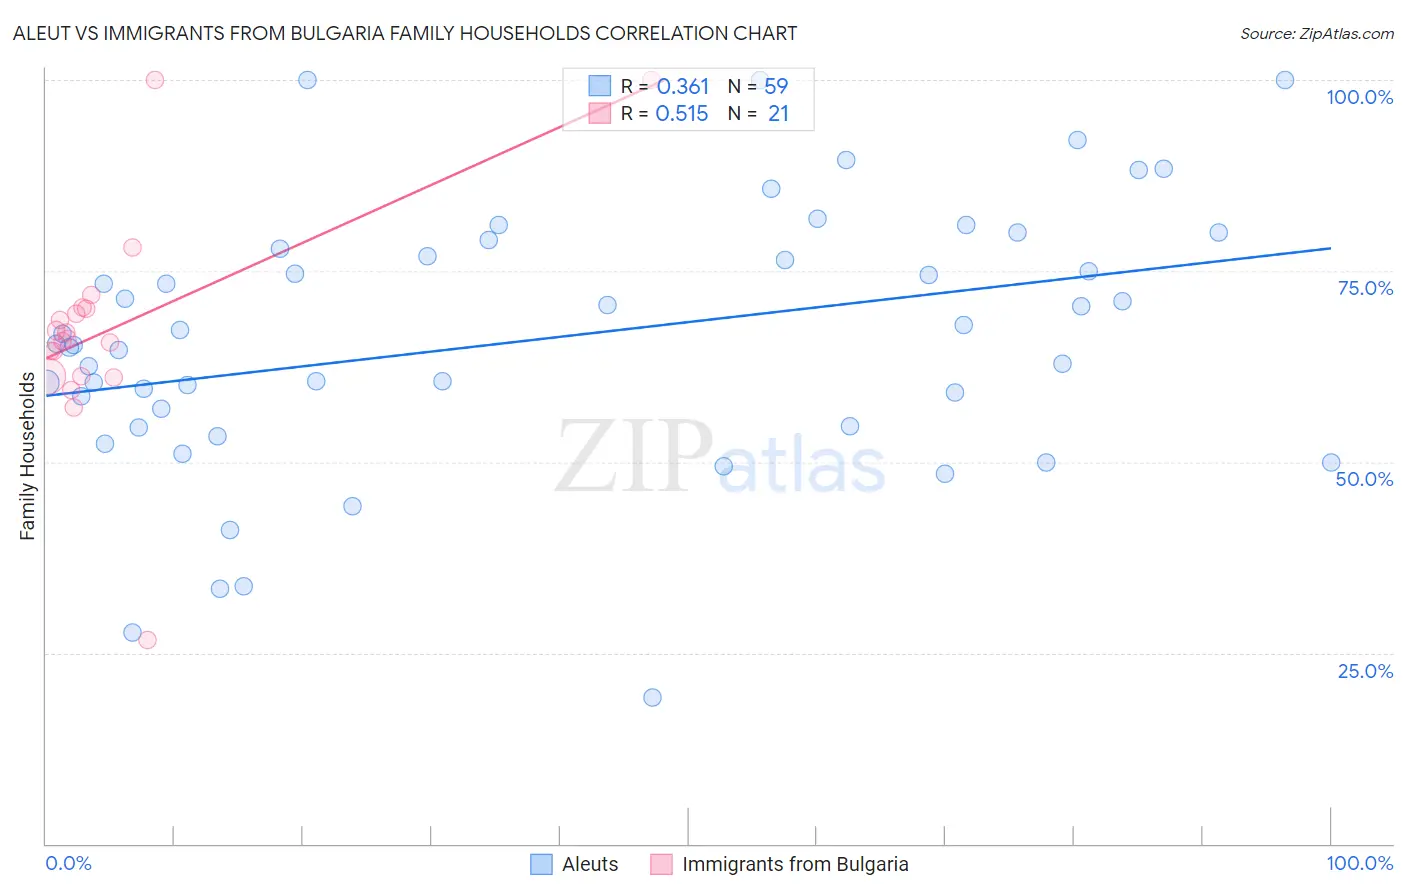
Aleut vs Immigrants from Bulgaria Family Households Correlation Chart
The statistical analysis conducted on geographies consisting of 61,774,066 people shows a mild positive correlation between the proportion of Aleuts and percentage of family households in the United States with a correlation coefficient (R) of 0.361 and weighted average of 63.4%. Similarly, the statistical analysis conducted on geographies consisting of 172,541,029 people shows a substantial positive correlation between the proportion of Immigrants from Bulgaria and percentage of family households in the United States with a correlation coefficient (R) of 0.515 and weighted average of 63.0%, a difference of 0.78%.
Family Households Correlation Summary
| Measurement | Aleut | Immigrants from Bulgaria |
| Minimum | 19.2% | 26.6% |
| Maximum | 100.0% | 100.0% |
| Range | 80.8% | 73.4% |
| Mean | 66.1% | 67.4% |
| Median | 65.4% | 66.1% |
| Interquartile 25% (IQ1) | 54.7% | 61.2% |
| Interquartile 75% (IQ3) | 77.9% | 70.1% |
| Interquartile Range (IQR) | 23.2% | 8.9% |
| Standard Deviation (Sample) | 17.3% | 14.6% |
| Standard Deviation (Population) | 17.2% | 14.2% |
Similar Demographics by Family Households
Demographics Similar to Aleuts by Family Households
In terms of family households, the demographic groups most similar to Aleuts are South African (63.4%, a difference of 0.0%), Immigrants from St. Vincent and the Grenadines (63.4%, a difference of 0.010%), Immigrants from Israel (63.4%, a difference of 0.010%), Comanche (63.5%, a difference of 0.030%), and Immigrants from Zimbabwe (63.5%, a difference of 0.030%).
| Demographics | Rating | Rank | Family Households |
| Immigrants | Northern Africa | 2.6 /100 | #232 | Tragic 63.5% |
| Immigrants | Armenia | 2.6 /100 | #233 | Tragic 63.5% |
| Finns | 2.3 /100 | #234 | Tragic 63.5% |
| Albanians | 2.2 /100 | #235 | Tragic 63.5% |
| Ghanaians | 2.1 /100 | #236 | Tragic 63.5% |
| Comanche | 2.1 /100 | #237 | Tragic 63.5% |
| Immigrants | Zimbabwe | 2.0 /100 | #238 | Tragic 63.5% |
| Aleuts | 1.9 /100 | #239 | Tragic 63.4% |
| South Africans | 1.9 /100 | #240 | Tragic 63.4% |
| Immigrants | St. Vincent and the Grenadines | 1.9 /100 | #241 | Tragic 63.4% |
| Immigrants | Israel | 1.8 /100 | #242 | Tragic 63.4% |
| Immigrants | Czechoslovakia | 1.8 /100 | #243 | Tragic 63.4% |
| Eastern Europeans | 1.6 /100 | #244 | Tragic 63.4% |
| Immigrants | Dominica | 1.6 /100 | #245 | Tragic 63.4% |
| Immigrants | Ghana | 1.6 /100 | #246 | Tragic 63.4% |
Demographics Similar to Immigrants from Bulgaria by Family Households
In terms of family households, the demographic groups most similar to Immigrants from Bulgaria are Immigrants from Yemen (63.0%, a difference of 0.010%), Immigrants from Belgium (63.0%, a difference of 0.050%), Ottawa (63.0%, a difference of 0.090%), Estonian (62.9%, a difference of 0.090%), and New Zealander (62.9%, a difference of 0.13%).
| Demographics | Rating | Rank | Family Households |
| Immigrants | Kazakhstan | 0.3 /100 | #273 | Tragic 63.1% |
| Lumbee | 0.3 /100 | #274 | Tragic 63.1% |
| West Indians | 0.3 /100 | #275 | Tragic 63.1% |
| Serbians | 0.3 /100 | #276 | Tragic 63.0% |
| Ottawa | 0.3 /100 | #277 | Tragic 63.0% |
| Immigrants | Belgium | 0.2 /100 | #278 | Tragic 63.0% |
| Immigrants | Yemen | 0.2 /100 | #279 | Tragic 63.0% |
| Immigrants | Bulgaria | 0.2 /100 | #280 | Tragic 63.0% |
| Estonians | 0.2 /100 | #281 | Tragic 62.9% |
| New Zealanders | 0.1 /100 | #282 | Tragic 62.9% |
| Immigrants | Denmark | 0.1 /100 | #283 | Tragic 62.9% |
| Australians | 0.1 /100 | #284 | Tragic 62.8% |
| Mongolians | 0.1 /100 | #285 | Tragic 62.8% |
| British West Indians | 0.1 /100 | #286 | Tragic 62.8% |
| Latvians | 0.1 /100 | #287 | Tragic 62.8% |