Asian vs Kenyan Family Households
COMPARE
Asian
Kenyan
Family Households
Family Households Comparison
Asians
Kenyans
66.5%
FAMILY HOUSEHOLDS
100.0/ 100
METRIC RATING
44th/ 347
METRIC RANK
63.2%
FAMILY HOUSEHOLDS
0.5/ 100
METRIC RATING
264th/ 347
METRIC RANK
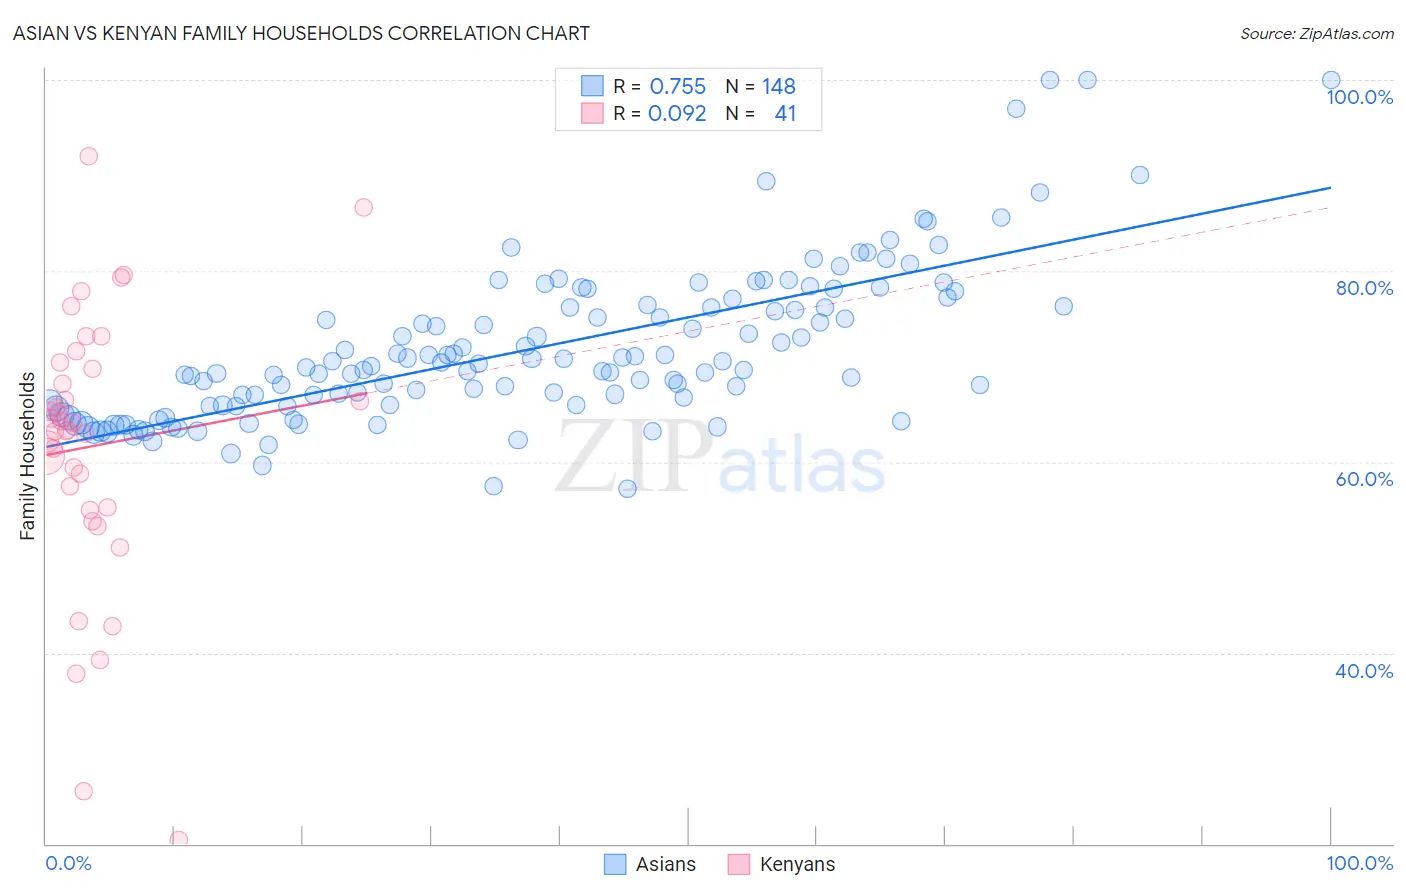
Asian vs Kenyan Family Households Correlation Chart
The statistical analysis conducted on geographies consisting of 550,272,164 people shows a strong positive correlation between the proportion of Asians and percentage of family households in the United States with a correlation coefficient (R) of 0.755 and weighted average of 66.5%. Similarly, the statistical analysis conducted on geographies consisting of 168,172,574 people shows a slight positive correlation between the proportion of Kenyans and percentage of family households in the United States with a correlation coefficient (R) of 0.092 and weighted average of 63.2%, a difference of 5.3%.
Family Households Correlation Summary
| Measurement | Asian | Kenyan |
| Minimum | 57.2% | 20.4% |
| Maximum | 100.0% | 92.0% |
| Range | 42.8% | 71.6% |
| Mean | 71.8% | 61.7% |
| Median | 70.0% | 63.4% |
| Interquartile 25% (IQ1) | 65.9% | 55.1% |
| Interquartile 75% (IQ3) | 76.2% | 70.1% |
| Interquartile Range (IQR) | 10.4% | 14.9% |
| Standard Deviation (Sample) | 8.1% | 14.5% |
| Standard Deviation (Population) | 8.1% | 14.4% |
Similar Demographics by Family Households
Demographics Similar to Asians by Family Households
In terms of family households, the demographic groups most similar to Asians are Venezuelan (66.5%, a difference of 0.020%), Apache (66.5%, a difference of 0.050%), Arapaho (66.5%, a difference of 0.050%), Menominee (66.5%, a difference of 0.060%), and Bolivian (66.5%, a difference of 0.070%).
| Demographics | Rating | Rank | Family Households |
| Tsimshian | 100.0 /100 | #37 | Exceptional 67.1% |
| Mexican American Indians | 100.0 /100 | #38 | Exceptional 67.0% |
| Immigrants | El Salvador | 100.0 /100 | #39 | Exceptional 67.0% |
| Guamanians/Chamorros | 100.0 /100 | #40 | Exceptional 66.6% |
| Immigrants | Bolivia | 100.0 /100 | #41 | Exceptional 66.6% |
| Menominee | 100.0 /100 | #42 | Exceptional 66.5% |
| Apache | 100.0 /100 | #43 | Exceptional 66.5% |
| Asians | 100.0 /100 | #44 | Exceptional 66.5% |
| Venezuelans | 100.0 /100 | #45 | Exceptional 66.5% |
| Arapaho | 100.0 /100 | #46 | Exceptional 66.5% |
| Bolivians | 100.0 /100 | #47 | Exceptional 66.5% |
| Immigrants | Venezuela | 100.0 /100 | #48 | Exceptional 66.4% |
| Immigrants | South Central Asia | 100.0 /100 | #49 | Exceptional 66.4% |
| Navajo | 100.0 /100 | #50 | Exceptional 66.4% |
| Natives/Alaskans | 100.0 /100 | #51 | Exceptional 66.4% |
Demographics Similar to Kenyans by Family Households
In terms of family households, the demographic groups most similar to Kenyans are Cheyenne (63.2%, a difference of 0.010%), Colville (63.2%, a difference of 0.010%), Immigrants from Western Africa (63.1%, a difference of 0.020%), Immigrants from Ireland (63.2%, a difference of 0.030%), and Immigrants from Russia (63.2%, a difference of 0.040%).
| Demographics | Rating | Rank | Family Households |
| Icelanders | 0.8 /100 | #257 | Tragic 63.3% |
| Immigrants | Barbados | 0.7 /100 | #258 | Tragic 63.2% |
| Immigrants | Western Europe | 0.6 /100 | #259 | Tragic 63.2% |
| Cypriots | 0.6 /100 | #260 | Tragic 63.2% |
| Immigrants | Russia | 0.6 /100 | #261 | Tragic 63.2% |
| Immigrants | Ireland | 0.6 /100 | #262 | Tragic 63.2% |
| Cheyenne | 0.5 /100 | #263 | Tragic 63.2% |
| Kenyans | 0.5 /100 | #264 | Tragic 63.2% |
| Colville | 0.5 /100 | #265 | Tragic 63.2% |
| Immigrants | Western Africa | 0.5 /100 | #266 | Tragic 63.1% |
| Israelis | 0.4 /100 | #267 | Tragic 63.1% |
| Immigrants | Singapore | 0.4 /100 | #268 | Tragic 63.1% |
| Yugoslavians | 0.4 /100 | #269 | Tragic 63.1% |
| Immigrants | Austria | 0.3 /100 | #270 | Tragic 63.1% |
| Immigrants | Croatia | 0.3 /100 | #271 | Tragic 63.1% |