Assyrian/Chaldean/Syriac vs Kiowa Average Family Size
COMPARE
Assyrian/Chaldean/Syriac
Kiowa
Average Family Size
Average Family Size Comparison
Assyrians/Chaldeans/Syriacs
Kiowa
3.24
AVERAGE FAMILY SIZE
73.8/ 100
METRIC RATING
149th/ 347
METRIC RANK
3.27
AVERAGE FAMILY SIZE
94.8/ 100
METRIC RATING
117th/ 347
METRIC RANK
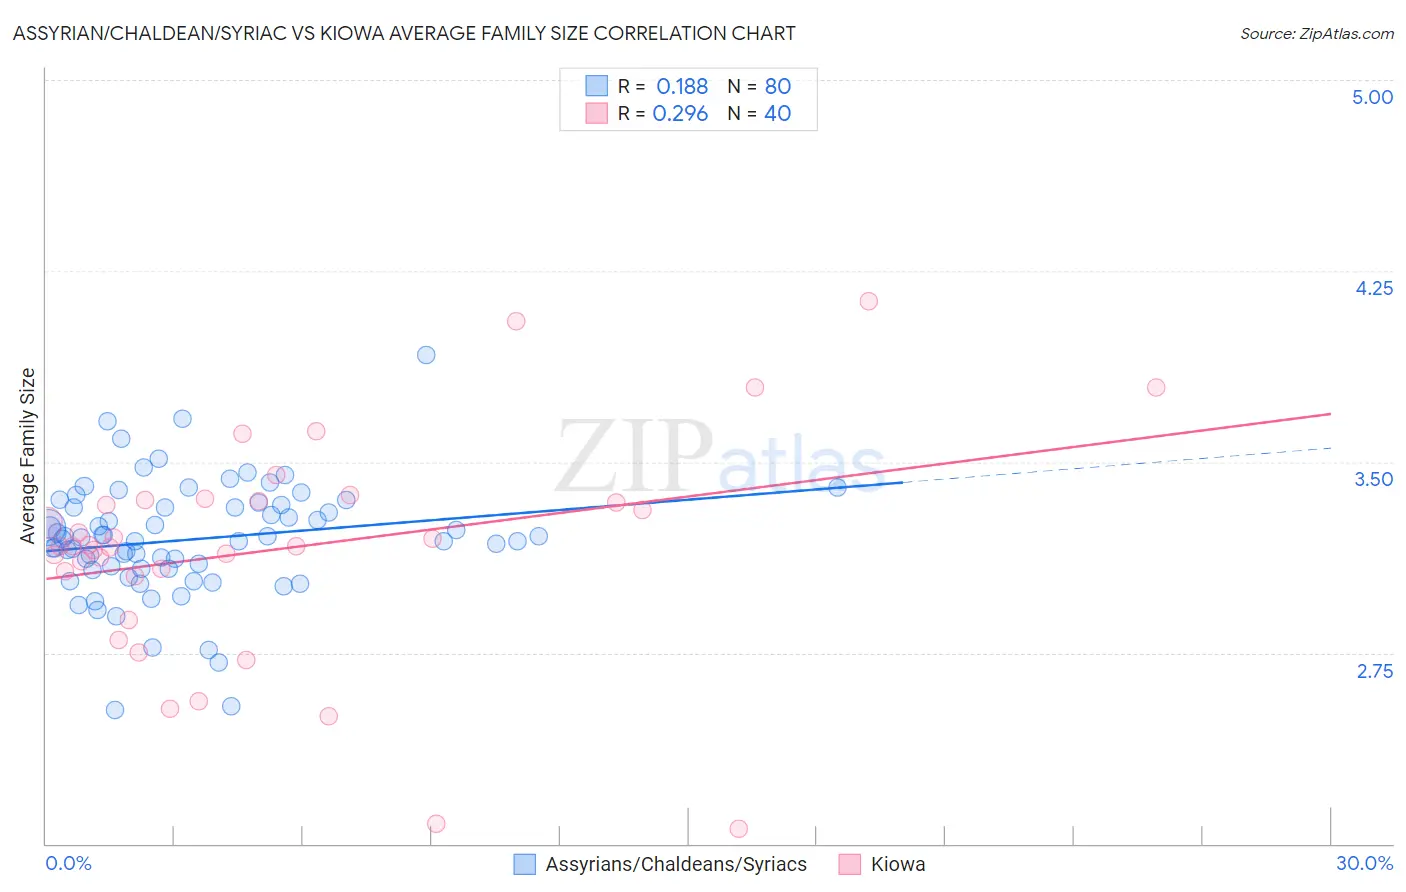
Assyrian/Chaldean/Syriac vs Kiowa Average Family Size Correlation Chart
The statistical analysis conducted on geographies consisting of 110,294,582 people shows a poor positive correlation between the proportion of Assyrians/Chaldeans/Syriacs and average family size in the United States with a correlation coefficient (R) of 0.188 and weighted average of 3.24. Similarly, the statistical analysis conducted on geographies consisting of 56,098,854 people shows a weak positive correlation between the proportion of Kiowa and average family size in the United States with a correlation coefficient (R) of 0.296 and weighted average of 3.27, a difference of 0.85%.
Average Family Size Correlation Summary
| Measurement | Assyrian/Chaldean/Syriac | Kiowa |
| Minimum | 2.52 | 2.06 |
| Maximum | 3.92 | 4.13 |
| Range | 1.40 | 2.07 |
| Mean | 3.20 | 3.16 |
| Median | 3.20 | 3.17 |
| Interquartile 25% (IQ1) | 3.08 | 3.06 |
| Interquartile 75% (IQ3) | 3.33 | 3.35 |
| Interquartile Range (IQR) | 0.25 | 0.29 |
| Standard Deviation (Sample) | 0.23 | 0.44 |
| Standard Deviation (Population) | 0.23 | 0.43 |
Similar Demographics by Average Family Size
Demographics Similar to Assyrians/Chaldeans/Syriacs by Average Family Size
In terms of average family size, the demographic groups most similar to Assyrians/Chaldeans/Syriacs are Indian (Asian) (3.24, a difference of 0.0%), Jordanian (3.24, a difference of 0.010%), Blackfeet (3.24, a difference of 0.030%), Spanish American (3.24, a difference of 0.030%), and Immigrants from Jordan (3.24, a difference of 0.050%).
| Demographics | Rating | Rank | Average Family Size |
| Liberians | 81.2 /100 | #142 | Excellent 3.25 |
| Bhutanese | 81.0 /100 | #143 | Excellent 3.25 |
| Tsimshian | 80.2 /100 | #144 | Excellent 3.25 |
| Armenians | 78.2 /100 | #145 | Good 3.25 |
| Immigrants | Africa | 77.9 /100 | #146 | Good 3.25 |
| Immigrants | Jordan | 75.7 /100 | #147 | Good 3.24 |
| Blackfeet | 75.0 /100 | #148 | Good 3.24 |
| Assyrians/Chaldeans/Syriacs | 73.8 /100 | #149 | Good 3.24 |
| Indians (Asian) | 73.6 /100 | #150 | Good 3.24 |
| Jordanians | 73.5 /100 | #151 | Good 3.24 |
| Spanish Americans | 72.5 /100 | #152 | Good 3.24 |
| Immigrants | Eritrea | 71.4 /100 | #153 | Good 3.24 |
| Immigrants | Egypt | 70.0 /100 | #154 | Good 3.24 |
| Seminole | 68.2 /100 | #155 | Good 3.24 |
| Immigrants | Taiwan | 68.1 /100 | #156 | Good 3.24 |
Demographics Similar to Kiowa by Average Family Size
In terms of average family size, the demographic groups most similar to Kiowa are Immigrants from Liberia (3.27, a difference of 0.020%), Immigrants from South America (3.27, a difference of 0.020%), South American (3.27, a difference of 0.030%), Immigrants from Asia (3.27, a difference of 0.070%), and Immigrants from Panama (3.27, a difference of 0.080%).
| Demographics | Rating | Rank | Average Family Size |
| Bahamians | 96.6 /100 | #110 | Exceptional 3.28 |
| Indonesians | 96.2 /100 | #111 | Exceptional 3.28 |
| Blacks/African Americans | 95.7 /100 | #112 | Exceptional 3.27 |
| Immigrants | Panama | 95.6 /100 | #113 | Exceptional 3.27 |
| South Americans | 95.1 /100 | #114 | Exceptional 3.27 |
| Immigrants | Liberia | 95.0 /100 | #115 | Exceptional 3.27 |
| Immigrants | South America | 95.0 /100 | #116 | Exceptional 3.27 |
| Kiowa | 94.8 /100 | #117 | Exceptional 3.27 |
| Immigrants | Asia | 94.0 /100 | #118 | Exceptional 3.27 |
| Immigrants | Indonesia | 93.7 /100 | #119 | Exceptional 3.27 |
| Immigrants | Bahamas | 93.6 /100 | #120 | Exceptional 3.27 |
| Immigrants | Thailand | 93.3 /100 | #121 | Exceptional 3.27 |
| Immigrants | Colombia | 92.8 /100 | #122 | Exceptional 3.27 |
| Alaskan Athabascans | 92.4 /100 | #123 | Exceptional 3.27 |
| South American Indians | 91.6 /100 | #124 | Exceptional 3.26 |