Assyrian/Chaldean/Syriac vs Pueblo Births to Unmarried Women
COMPARE
Assyrian/Chaldean/Syriac
Pueblo
Births to Unmarried Women
Births to Unmarried Women Comparison
Assyrians/Chaldeans/Syriacs
Pueblo
22.0%
BIRTHS TO UNMARRIED WOMEN
100.0/ 100
METRIC RATING
1st/ 347
METRIC RANK
53.7%
BIRTHS TO UNMARRIED WOMEN
0.0/ 100
METRIC RATING
346th/ 347
METRIC RANK
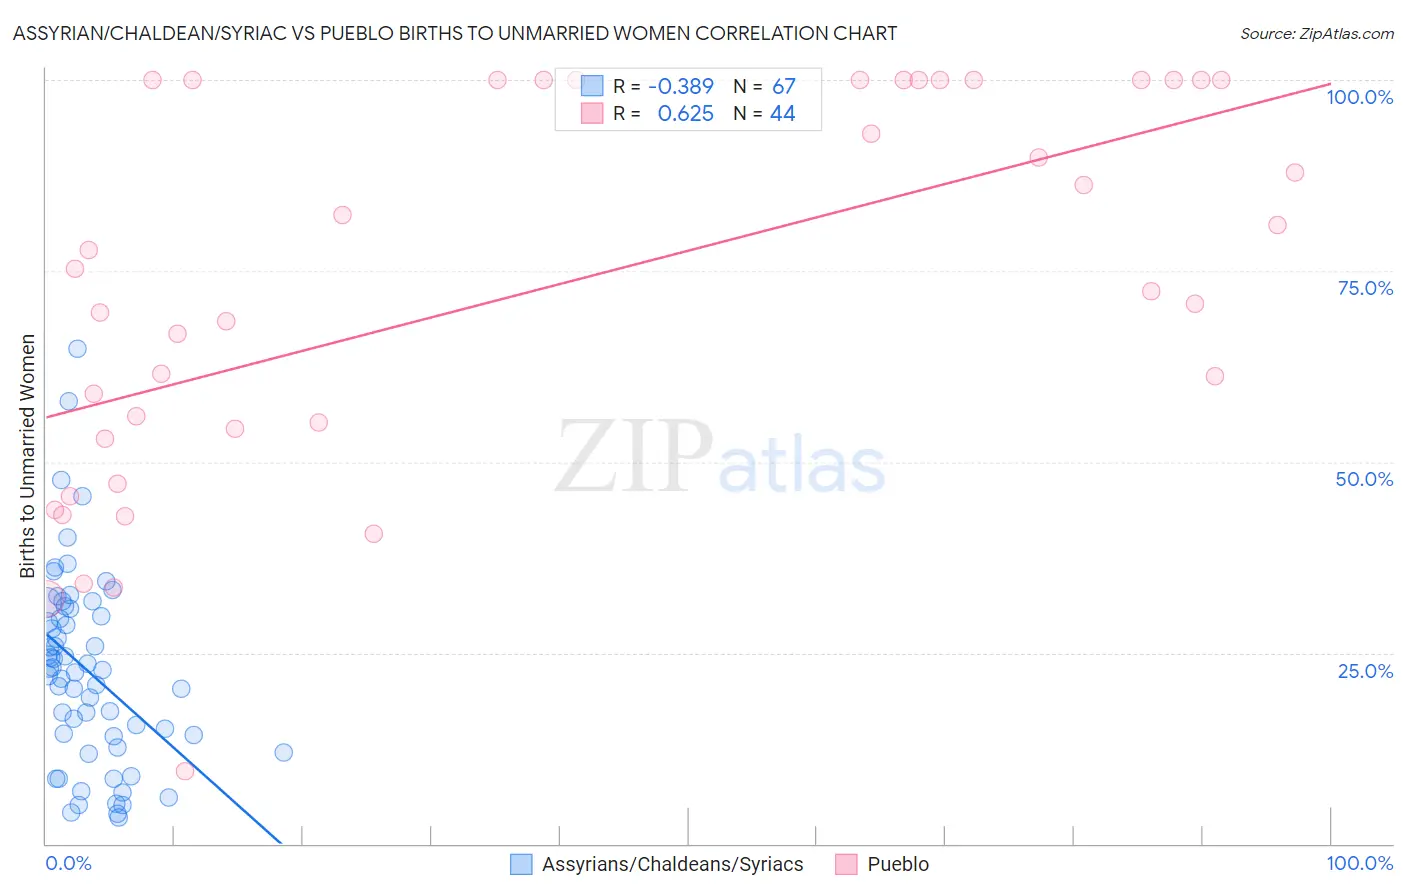
Assyrian/Chaldean/Syriac vs Pueblo Births to Unmarried Women Correlation Chart
The statistical analysis conducted on geographies consisting of 106,724,446 people shows a mild negative correlation between the proportion of Assyrians/Chaldeans/Syriacs and percentage of births to unmarried women in the United States with a correlation coefficient (R) of -0.389 and weighted average of 22.0%. Similarly, the statistical analysis conducted on geographies consisting of 117,205,072 people shows a significant positive correlation between the proportion of Pueblo and percentage of births to unmarried women in the United States with a correlation coefficient (R) of 0.625 and weighted average of 53.7%, a difference of 144.2%.
Births to Unmarried Women Correlation Summary
| Measurement | Assyrian/Chaldean/Syriac | Pueblo |
| Minimum | 3.5% | 9.5% |
| Maximum | 64.8% | 100.0% |
| Range | 61.3% | 90.5% |
| Mean | 22.7% | 72.6% |
| Median | 22.7% | 73.8% |
| Interquartile 25% (IQ1) | 14.0% | 53.7% |
| Interquartile 75% (IQ3) | 30.8% | 100.0% |
| Interquartile Range (IQR) | 16.8% | 46.3% |
| Standard Deviation (Sample) | 12.6% | 25.2% |
| Standard Deviation (Population) | 12.5% | 24.9% |
Similar Demographics by Births to Unmarried Women
Demographics Similar to Assyrians/Chaldeans/Syriacs by Births to Unmarried Women
In terms of births to unmarried women, the demographic groups most similar to Assyrians/Chaldeans/Syriacs are Immigrants from India (22.9%, a difference of 4.2%), Filipino (23.0%, a difference of 4.6%), Immigrants from Taiwan (23.0%, a difference of 4.7%), Immigrants from Hong Kong (23.6%, a difference of 7.3%), and Immigrants from Iran (24.0%, a difference of 9.0%).
| Demographics | Rating | Rank | Births to Unmarried Women |
| Assyrians/Chaldeans/Syriacs | 100.0 /100 | #1 | Exceptional 22.0% |
| Immigrants | India | 100.0 /100 | #2 | Exceptional 22.9% |
| Filipinos | 100.0 /100 | #3 | Exceptional 23.0% |
| Immigrants | Taiwan | 100.0 /100 | #4 | Exceptional 23.0% |
| Immigrants | Hong Kong | 100.0 /100 | #5 | Exceptional 23.6% |
| Immigrants | Iran | 100.0 /100 | #6 | Exceptional 24.0% |
| Thais | 100.0 /100 | #7 | Exceptional 24.0% |
| Immigrants | China | 100.0 /100 | #8 | Exceptional 24.7% |
| Immigrants | South Central Asia | 100.0 /100 | #9 | Exceptional 24.7% |
| Immigrants | Eastern Asia | 100.0 /100 | #10 | Exceptional 25.0% |
| Immigrants | Israel | 100.0 /100 | #11 | Exceptional 25.1% |
| Indians (Asian) | 100.0 /100 | #12 | Exceptional 25.3% |
| Iranians | 100.0 /100 | #13 | Exceptional 25.3% |
| Immigrants | Lebanon | 100.0 /100 | #14 | Exceptional 25.3% |
| Immigrants | Singapore | 100.0 /100 | #15 | Exceptional 25.6% |
Demographics Similar to Pueblo by Births to Unmarried Women
In terms of births to unmarried women, the demographic groups most similar to Pueblo are Inupiat (52.1%, a difference of 3.0%), Navajo (51.5%, a difference of 4.2%), Pima (51.5%, a difference of 4.2%), Menominee (51.1%, a difference of 5.0%), and Yup'ik (56.4%, a difference of 5.2%).
| Demographics | Rating | Rank | Births to Unmarried Women |
| Blacks/African Americans | 0.0 /100 | #333 | Tragic 44.3% |
| Yuman | 0.0 /100 | #334 | Tragic 44.4% |
| Colville | 0.0 /100 | #335 | Tragic 45.3% |
| Puerto Ricans | 0.0 /100 | #336 | Tragic 45.7% |
| Houma | 0.0 /100 | #337 | Tragic 46.6% |
| Arapaho | 0.0 /100 | #338 | Tragic 47.1% |
| Lumbee | 0.0 /100 | #339 | Tragic 48.2% |
| Tohono O'odham | 0.0 /100 | #340 | Tragic 49.8% |
| Hopi | 0.0 /100 | #341 | Tragic 50.8% |
| Menominee | 0.0 /100 | #342 | Tragic 51.1% |
| Pima | 0.0 /100 | #343 | Tragic 51.5% |
| Navajo | 0.0 /100 | #344 | Tragic 51.5% |
| Inupiat | 0.0 /100 | #345 | Tragic 52.1% |
| Pueblo | 0.0 /100 | #346 | Tragic 53.7% |
| Yup'ik | 0.0 /100 | #347 | Tragic 56.4% |