Bahamian vs German Russian Married-couple Households
COMPARE
Bahamian
German Russian
Married-couple Households
Married-couple Households Comparison
Bahamians
German Russians
40.5%
MARRIED-COUPLE HOUSEHOLDS
0.0/ 100
METRIC RATING
319th/ 347
METRIC RANK
44.0%
MARRIED-COUPLE HOUSEHOLDS
0.4/ 100
METRIC RATING
251st/ 347
METRIC RANK
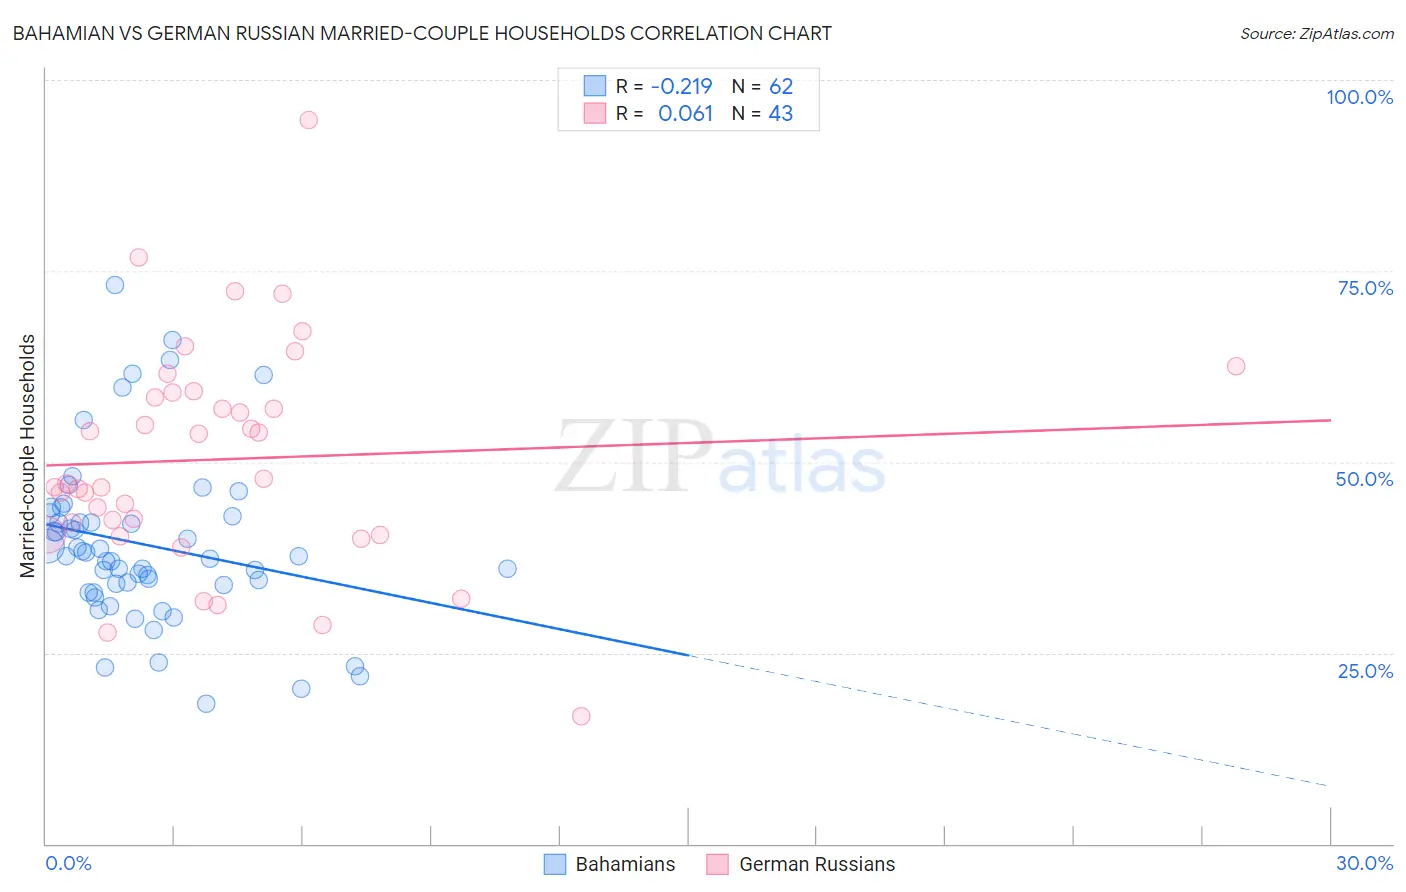
Bahamian vs German Russian Married-couple Households Correlation Chart
The statistical analysis conducted on geographies consisting of 112,634,221 people shows a weak negative correlation between the proportion of Bahamians and percentage of married-couple family households in the United States with a correlation coefficient (R) of -0.219 and weighted average of 40.5%. Similarly, the statistical analysis conducted on geographies consisting of 96,451,375 people shows a slight positive correlation between the proportion of German Russians and percentage of married-couple family households in the United States with a correlation coefficient (R) of 0.061 and weighted average of 44.0%, a difference of 8.6%.
Married-couple Households Correlation Summary
| Measurement | Bahamian | German Russian |
| Minimum | 18.4% | 16.7% |
| Maximum | 73.1% | 94.7% |
| Range | 54.8% | 78.1% |
| Mean | 39.2% | 50.3% |
| Median | 37.7% | 47.1% |
| Interquartile 25% (IQ1) | 33.9% | 40.4% |
| Interquartile 75% (IQ3) | 42.9% | 59.0% |
| Interquartile Range (IQR) | 9.0% | 18.6% |
| Standard Deviation (Sample) | 10.9% | 14.7% |
| Standard Deviation (Population) | 10.8% | 14.5% |
Similar Demographics by Married-couple Households
Demographics Similar to Bahamians by Married-couple Households
In terms of married-couple households, the demographic groups most similar to Bahamians are Liberian (40.7%, a difference of 0.35%), Immigrants from Jamaica (40.7%, a difference of 0.36%), West Indian (40.3%, a difference of 0.42%), Immigrants from Liberia (40.3%, a difference of 0.45%), and Immigrants from Caribbean (40.8%, a difference of 0.65%).
| Demographics | Rating | Rank | Married-couple Households |
| Africans | 0.0 /100 | #312 | Tragic 40.9% |
| Immigrants | Haiti | 0.0 /100 | #313 | Tragic 40.9% |
| Jamaicans | 0.0 /100 | #314 | Tragic 40.9% |
| Trinidadians and Tobagonians | 0.0 /100 | #315 | Tragic 40.9% |
| Immigrants | Caribbean | 0.0 /100 | #316 | Tragic 40.8% |
| Immigrants | Jamaica | 0.0 /100 | #317 | Tragic 40.7% |
| Liberians | 0.0 /100 | #318 | Tragic 40.7% |
| Bahamians | 0.0 /100 | #319 | Tragic 40.5% |
| West Indians | 0.0 /100 | #320 | Tragic 40.3% |
| Immigrants | Liberia | 0.0 /100 | #321 | Tragic 40.3% |
| Immigrants | Zaire | 0.0 /100 | #322 | Tragic 40.1% |
| Puerto Ricans | 0.0 /100 | #323 | Tragic 40.1% |
| Navajo | 0.0 /100 | #324 | Tragic 40.1% |
| Pueblo | 0.0 /100 | #325 | Tragic 40.0% |
| U.S. Virgin Islanders | 0.0 /100 | #326 | Tragic 39.8% |
Demographics Similar to German Russians by Married-couple Households
In terms of married-couple households, the demographic groups most similar to German Russians are Seminole (44.0%, a difference of 0.070%), French American Indian (44.1%, a difference of 0.080%), Immigrants from Kenya (44.1%, a difference of 0.090%), Yup'ik (44.1%, a difference of 0.14%), and Central American (43.9%, a difference of 0.19%).
| Demographics | Rating | Rank | Married-couple Households |
| Immigrants | Armenia | 0.7 /100 | #244 | Tragic 44.3% |
| Immigrants | El Salvador | 0.7 /100 | #245 | Tragic 44.3% |
| Immigrants | Cuba | 0.6 /100 | #246 | Tragic 44.2% |
| Immigrants | Morocco | 0.6 /100 | #247 | Tragic 44.2% |
| Yup'ik | 0.4 /100 | #248 | Tragic 44.1% |
| Immigrants | Kenya | 0.4 /100 | #249 | Tragic 44.1% |
| French American Indians | 0.4 /100 | #250 | Tragic 44.1% |
| German Russians | 0.4 /100 | #251 | Tragic 44.0% |
| Seminole | 0.4 /100 | #252 | Tragic 44.0% |
| Central Americans | 0.3 /100 | #253 | Tragic 43.9% |
| Apache | 0.3 /100 | #254 | Tragic 43.9% |
| Shoshone | 0.3 /100 | #255 | Tragic 43.9% |
| Ugandans | 0.3 /100 | #256 | Tragic 43.8% |
| Blackfeet | 0.2 /100 | #257 | Tragic 43.8% |
| Central American Indians | 0.2 /100 | #258 | Tragic 43.8% |