Bhutanese vs European Married-couple Households
COMPARE
Bhutanese
European
Married-couple Households
Married-couple Households Comparison
Bhutanese
Europeans
49.3%
MARRIED-COUPLE HOUSEHOLDS
99.8/ 100
METRIC RATING
27th/ 347
METRIC RANK
49.6%
MARRIED-COUPLE HOUSEHOLDS
99.9/ 100
METRIC RATING
19th/ 347
METRIC RANK
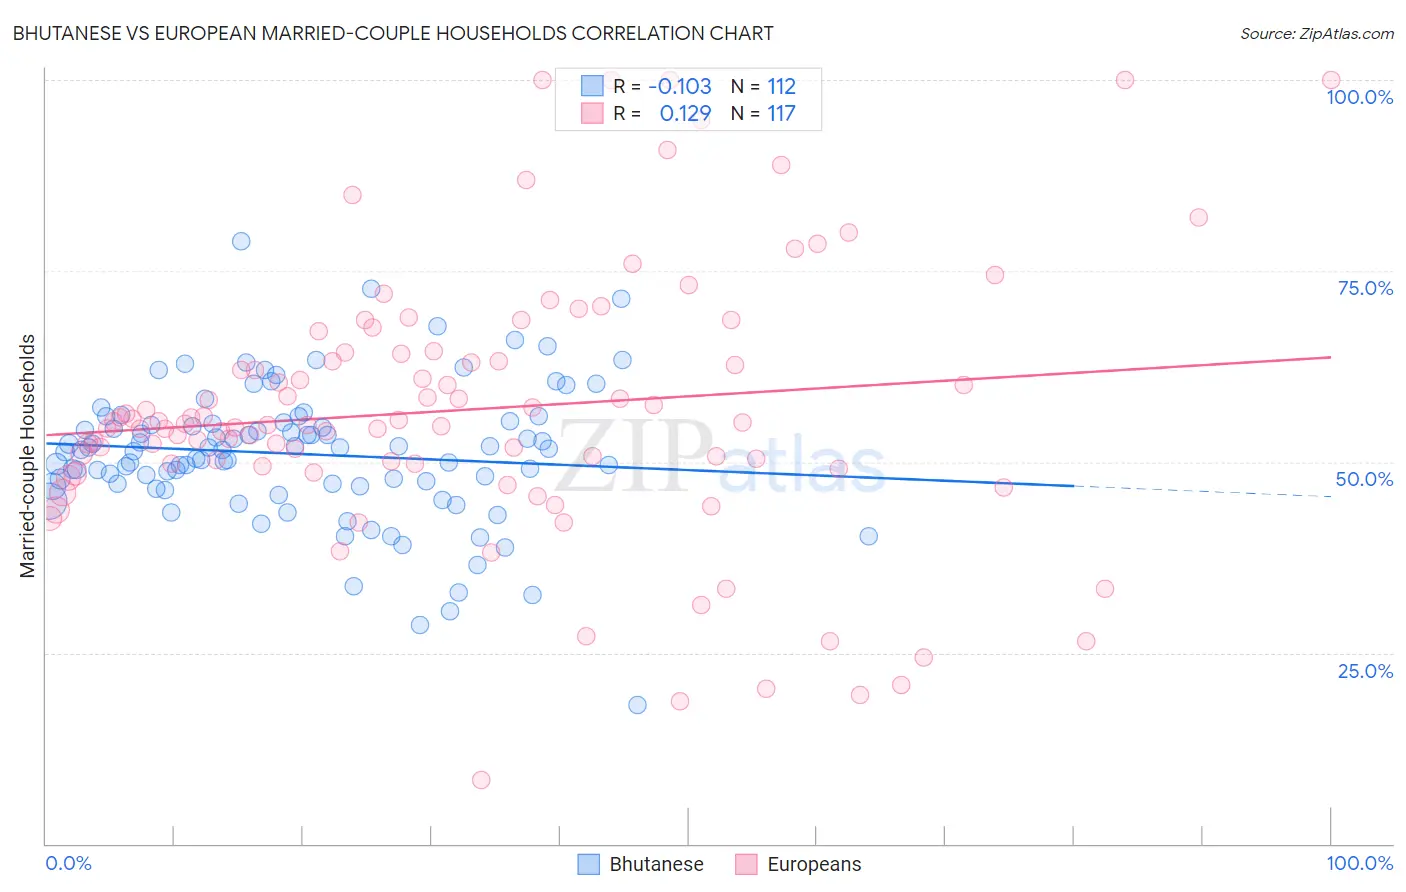
Bhutanese vs European Married-couple Households Correlation Chart
The statistical analysis conducted on geographies consisting of 455,135,047 people shows a poor negative correlation between the proportion of Bhutanese and percentage of married-couple family households in the United States with a correlation coefficient (R) of -0.103 and weighted average of 49.3%. Similarly, the statistical analysis conducted on geographies consisting of 561,207,916 people shows a poor positive correlation between the proportion of Europeans and percentage of married-couple family households in the United States with a correlation coefficient (R) of 0.129 and weighted average of 49.6%, a difference of 0.60%.
Married-couple Households Correlation Summary
| Measurement | Bhutanese | European |
| Minimum | 18.2% | 8.3% |
| Maximum | 78.9% | 100.0% |
| Range | 60.7% | 91.7% |
| Mean | 51.0% | 56.8% |
| Median | 51.5% | 54.9% |
| Interquartile 25% (IQ1) | 47.0% | 49.6% |
| Interquartile 75% (IQ3) | 55.1% | 64.2% |
| Interquartile Range (IQR) | 8.1% | 14.6% |
| Standard Deviation (Sample) | 9.0% | 17.7% |
| Standard Deviation (Population) | 9.0% | 17.6% |
Demographics Similar to Bhutanese and Europeans by Married-couple Households
In terms of married-couple households, the demographic groups most similar to Bhutanese are Immigrants from Scotland (49.3%, a difference of 0.020%), Immigrants from Philippines (49.3%, a difference of 0.15%), German (49.2%, a difference of 0.19%), Maltese (49.2%, a difference of 0.20%), and Bolivian (49.2%, a difference of 0.21%). Similarly, the demographic groups most similar to Europeans are Scandinavian (49.6%, a difference of 0.0%), Norwegian (49.5%, a difference of 0.060%), English (49.6%, a difference of 0.16%), Immigrants from Hong Kong (49.6%, a difference of 0.17%), and Asian (49.5%, a difference of 0.17%).
| Demographics | Rating | Rank | Married-couple Households |
| Immigrants | Korea | 100.0 /100 | #13 | Exceptional 49.9% |
| Burmese | 100.0 /100 | #14 | Exceptional 49.8% |
| Koreans | 99.9 /100 | #15 | Exceptional 49.7% |
| Swedes | 99.9 /100 | #16 | Exceptional 49.7% |
| Immigrants | Hong Kong | 99.9 /100 | #17 | Exceptional 49.6% |
| English | 99.9 /100 | #18 | Exceptional 49.6% |
| Europeans | 99.9 /100 | #19 | Exceptional 49.6% |
| Scandinavians | 99.9 /100 | #20 | Exceptional 49.6% |
| Norwegians | 99.9 /100 | #21 | Exceptional 49.5% |
| Asians | 99.9 /100 | #22 | Exceptional 49.5% |
| Dutch | 99.9 /100 | #23 | Exceptional 49.5% |
| Czechs | 99.9 /100 | #24 | Exceptional 49.4% |
| Immigrants | Philippines | 99.9 /100 | #25 | Exceptional 49.3% |
| Immigrants | Scotland | 99.8 /100 | #26 | Exceptional 49.3% |
| Bhutanese | 99.8 /100 | #27 | Exceptional 49.3% |
| Germans | 99.8 /100 | #28 | Exceptional 49.2% |
| Maltese | 99.8 /100 | #29 | Exceptional 49.2% |
| Bolivians | 99.8 /100 | #30 | Exceptional 49.2% |
| Native Hawaiians | 99.8 /100 | #31 | Exceptional 49.1% |
| Hungarians | 99.8 /100 | #32 | Exceptional 49.1% |
| Immigrants | Asia | 99.7 /100 | #33 | Exceptional 49.1% |