Bolivian vs Immigrants from North Macedonia Family Households with Children
COMPARE
Bolivian
Immigrants from North Macedonia
Family Households with Children
Family Households with Children Comparison
Bolivians
Immigrants from North Macedonia
29.5%
FAMILY HOUSEHOLDS WITH CHILDREN
100.0/ 100
METRIC RATING
29th/ 347
METRIC RANK
26.7%
FAMILY HOUSEHOLDS WITH CHILDREN
1.0/ 100
METRIC RATING
263rd/ 347
METRIC RANK
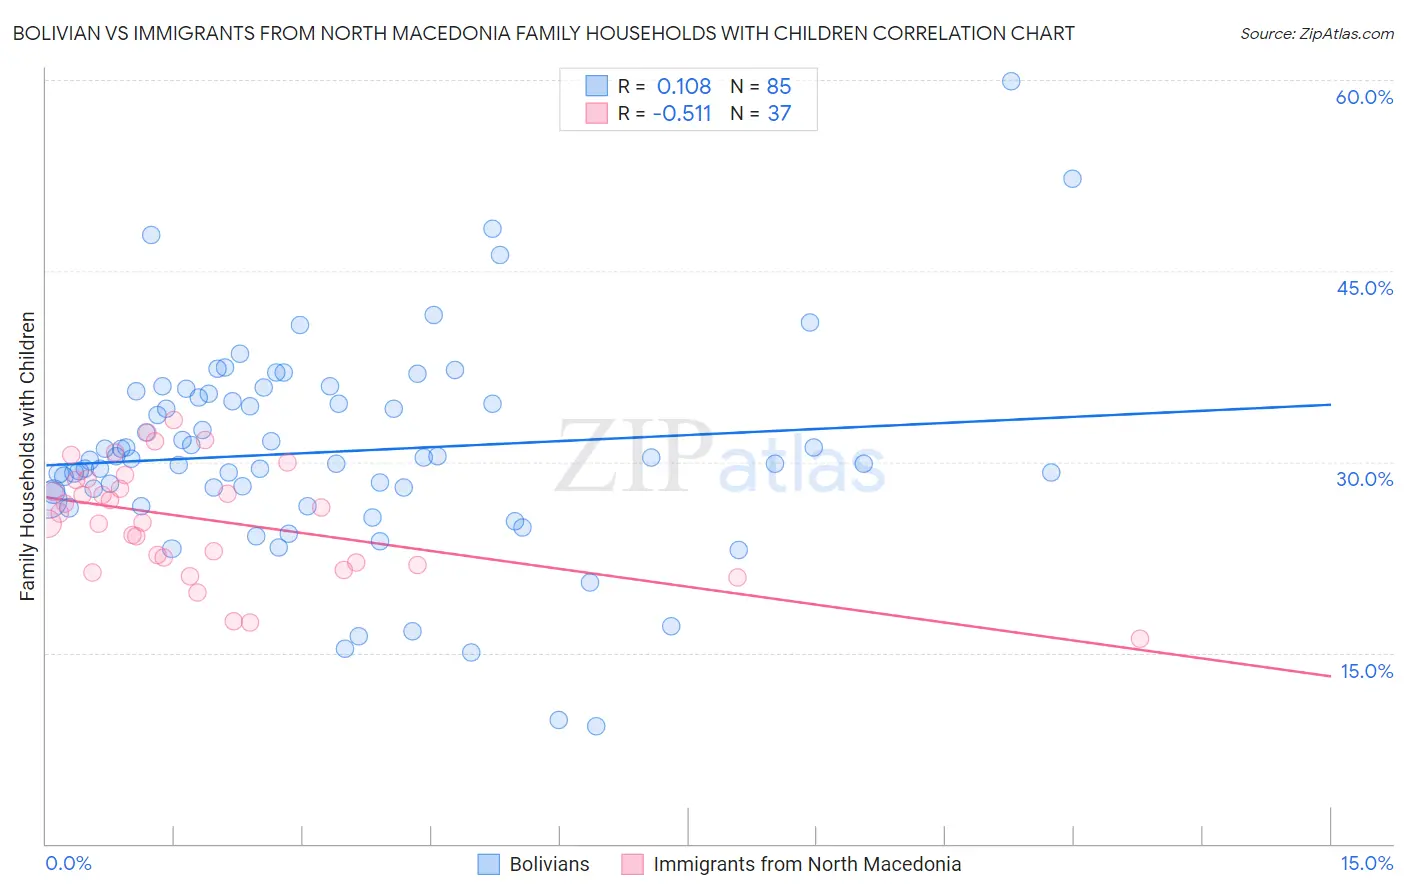
Bolivian vs Immigrants from North Macedonia Family Households with Children Correlation Chart
The statistical analysis conducted on geographies consisting of 184,562,629 people shows a poor positive correlation between the proportion of Bolivians and percentage of family households with children in the United States with a correlation coefficient (R) of 0.108 and weighted average of 29.5%. Similarly, the statistical analysis conducted on geographies consisting of 74,300,387 people shows a substantial negative correlation between the proportion of Immigrants from North Macedonia and percentage of family households with children in the United States with a correlation coefficient (R) of -0.511 and weighted average of 26.7%, a difference of 10.3%.
Family Households with Children Correlation Summary
| Measurement | Bolivian | Immigrants from North Macedonia |
| Minimum | 9.2% | 16.1% |
| Maximum | 59.9% | 33.3% |
| Range | 50.7% | 17.2% |
| Mean | 30.8% | 25.5% |
| Median | 30.3% | 26.0% |
| Interquartile 25% (IQ1) | 27.3% | 22.0% |
| Interquartile 75% (IQ3) | 35.2% | 28.6% |
| Interquartile Range (IQR) | 7.8% | 6.7% |
| Standard Deviation (Sample) | 8.2% | 4.4% |
| Standard Deviation (Population) | 8.2% | 4.3% |
Similar Demographics by Family Households with Children
Demographics Similar to Bolivians by Family Households with Children
In terms of family households with children, the demographic groups most similar to Bolivians are Samoan (29.5%, a difference of 0.0%), Yuman (29.5%, a difference of 0.030%), Immigrants from Vietnam (29.5%, a difference of 0.16%), Japanese (29.4%, a difference of 0.18%), and Sri Lankan (29.5%, a difference of 0.19%).
| Demographics | Rating | Rank | Family Households with Children |
| Malaysians | 100.0 /100 | #22 | Exceptional 29.8% |
| Mexican American Indians | 100.0 /100 | #23 | Exceptional 29.7% |
| Guamanians/Chamorros | 100.0 /100 | #24 | Exceptional 29.7% |
| Immigrants | Latin America | 100.0 /100 | #25 | Exceptional 29.7% |
| Sri Lankans | 100.0 /100 | #26 | Exceptional 29.5% |
| Immigrants | Vietnam | 100.0 /100 | #27 | Exceptional 29.5% |
| Samoans | 100.0 /100 | #28 | Exceptional 29.5% |
| Bolivians | 100.0 /100 | #29 | Exceptional 29.5% |
| Yuman | 100.0 /100 | #30 | Exceptional 29.5% |
| Japanese | 100.0 /100 | #31 | Exceptional 29.4% |
| Immigrants | Yemen | 100.0 /100 | #32 | Exceptional 29.4% |
| Venezuelans | 100.0 /100 | #33 | Exceptional 29.4% |
| Immigrants | Bolivia | 100.0 /100 | #34 | Exceptional 29.3% |
| Immigrants | Sierra Leone | 100.0 /100 | #35 | Exceptional 29.3% |
| Immigrants | Venezuela | 100.0 /100 | #36 | Exceptional 29.3% |
Demographics Similar to Immigrants from North Macedonia by Family Households with Children
In terms of family households with children, the demographic groups most similar to Immigrants from North Macedonia are Immigrants from Russia (26.8%, a difference of 0.0%), Taiwanese (26.7%, a difference of 0.030%), Chippewa (26.7%, a difference of 0.040%), Maltese (26.7%, a difference of 0.050%), and Immigrants from Uzbekistan (26.7%, a difference of 0.050%).
| Demographics | Rating | Rank | Family Households with Children |
| Scotch-Irish | 1.4 /100 | #256 | Tragic 26.8% |
| Slavs | 1.3 /100 | #257 | Tragic 26.8% |
| Immigrants | Cuba | 1.3 /100 | #258 | Tragic 26.8% |
| Immigrants | Lithuania | 1.2 /100 | #259 | Tragic 26.8% |
| Immigrants | Jamaica | 1.2 /100 | #260 | Tragic 26.8% |
| Immigrants | Belarus | 1.1 /100 | #261 | Tragic 26.8% |
| Immigrants | Russia | 1.0 /100 | #262 | Tragic 26.8% |
| Immigrants | North Macedonia | 1.0 /100 | #263 | Tragic 26.7% |
| Taiwanese | 0.9 /100 | #264 | Tragic 26.7% |
| Chippewa | 0.9 /100 | #265 | Tragic 26.7% |
| Maltese | 0.9 /100 | #266 | Tragic 26.7% |
| Immigrants | Uzbekistan | 0.9 /100 | #267 | Tragic 26.7% |
| Immigrants | Belgium | 0.9 /100 | #268 | Tragic 26.7% |
| Immigrants | Denmark | 0.8 /100 | #269 | Tragic 26.7% |
| Immigrants | Zaire | 0.7 /100 | #270 | Tragic 26.7% |