Cajun vs Barbadian Family Households
COMPARE
Cajun
Barbadian
Family Households
Family Households Comparison
Cajuns
Barbadians
64.8%
FAMILY HOUSEHOLDS
89.4/ 100
METRIC RATING
132nd/ 347
METRIC RANK
62.5%
FAMILY HOUSEHOLDS
0.0/ 100
METRIC RATING
294th/ 347
METRIC RANK
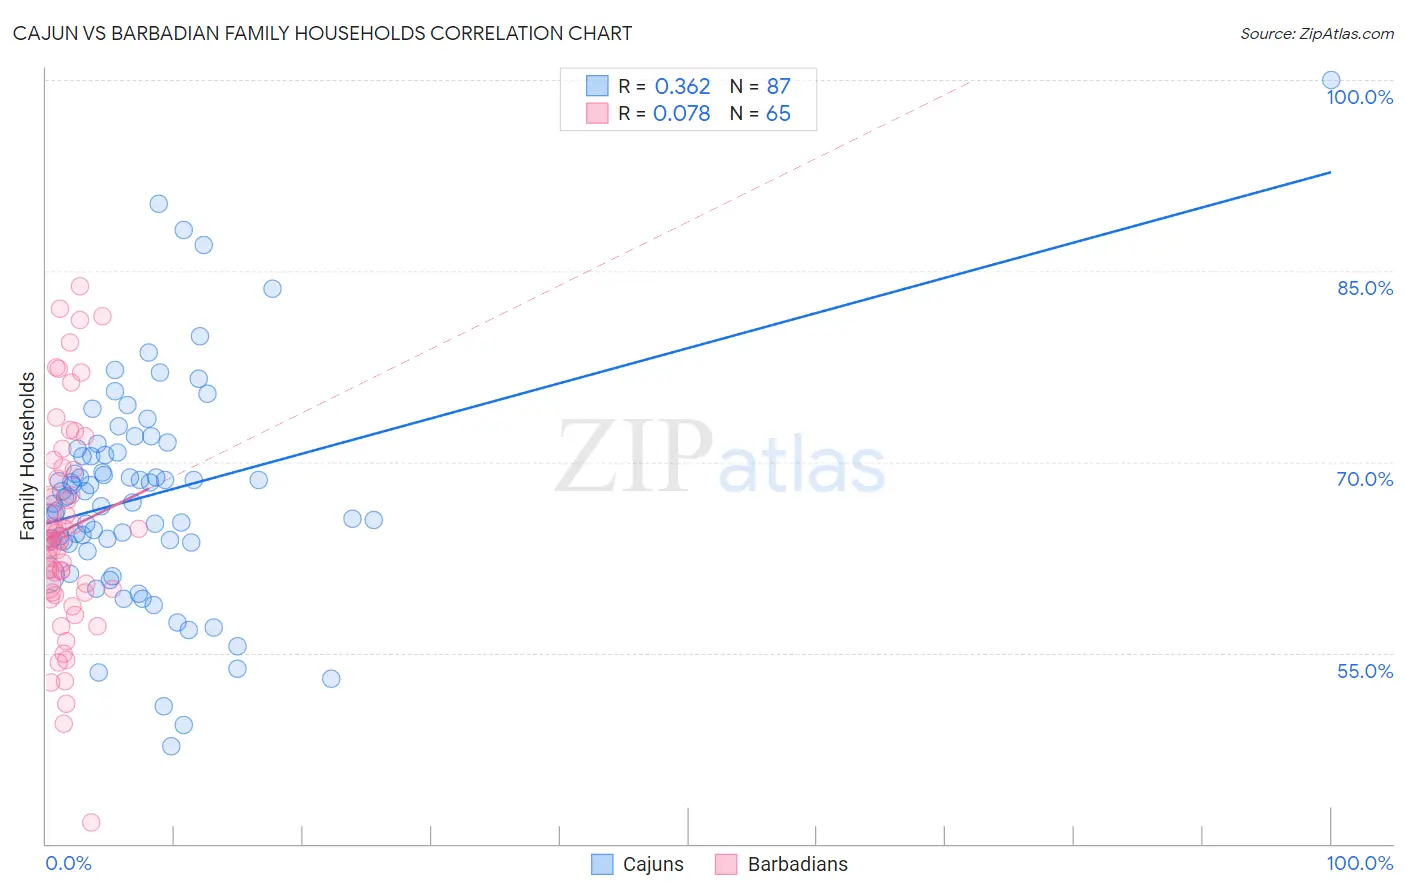
Cajun vs Barbadian Family Households Correlation Chart
The statistical analysis conducted on geographies consisting of 149,695,707 people shows a mild positive correlation between the proportion of Cajuns and percentage of family households in the United States with a correlation coefficient (R) of 0.362 and weighted average of 64.8%. Similarly, the statistical analysis conducted on geographies consisting of 141,274,787 people shows a slight positive correlation between the proportion of Barbadians and percentage of family households in the United States with a correlation coefficient (R) of 0.078 and weighted average of 62.5%, a difference of 3.7%.
Family Households Correlation Summary
| Measurement | Cajun | Barbadian |
| Minimum | 47.6% | 41.7% |
| Maximum | 100.0% | 83.8% |
| Range | 52.4% | 42.1% |
| Mean | 67.3% | 64.7% |
| Median | 67.2% | 63.8% |
| Interquartile 25% (IQ1) | 63.6% | 59.8% |
| Interquartile 75% (IQ3) | 70.7% | 69.5% |
| Interquartile Range (IQR) | 7.1% | 9.7% |
| Standard Deviation (Sample) | 8.6% | 8.4% |
| Standard Deviation (Population) | 8.6% | 8.3% |
Similar Demographics by Family Households
Demographics Similar to Cajuns by Family Households
In terms of family households, the demographic groups most similar to Cajuns are Belizean (64.8%, a difference of 0.0%), Nonimmigrants (64.8%, a difference of 0.020%), Immigrants from Italy (64.8%, a difference of 0.030%), Greek (64.7%, a difference of 0.040%), and Maltese (64.7%, a difference of 0.060%).
| Demographics | Rating | Rank | Family Households |
| Immigrants | Belize | 92.7 /100 | #125 | Exceptional 64.9% |
| Panamanians | 92.4 /100 | #126 | Exceptional 64.8% |
| Immigrants | Panama | 92.0 /100 | #127 | Exceptional 64.8% |
| Italians | 91.9 /100 | #128 | Exceptional 64.8% |
| Immigrants | Ecuador | 91.4 /100 | #129 | Exceptional 64.8% |
| Immigrants | Italy | 90.2 /100 | #130 | Exceptional 64.8% |
| Immigrants | Nonimmigrants | 90.1 /100 | #131 | Exceptional 64.8% |
| Cajuns | 89.4 /100 | #132 | Excellent 64.8% |
| Belizeans | 89.3 /100 | #133 | Excellent 64.8% |
| Greeks | 88.1 /100 | #134 | Excellent 64.7% |
| Maltese | 87.4 /100 | #135 | Excellent 64.7% |
| Immigrants | China | 86.6 /100 | #136 | Excellent 64.7% |
| Immigrants | Scotland | 86.4 /100 | #137 | Excellent 64.7% |
| Basques | 85.5 /100 | #138 | Excellent 64.7% |
| Immigrants | Jamaica | 85.3 /100 | #139 | Excellent 64.7% |
Demographics Similar to Barbadians by Family Households
In terms of family households, the demographic groups most similar to Barbadians are Okinawan (62.5%, a difference of 0.010%), Slovene (62.4%, a difference of 0.020%), French American Indian (62.4%, a difference of 0.040%), Immigrants from Sweden (62.5%, a difference of 0.060%), and Immigrants from Spain (62.4%, a difference of 0.060%).
| Demographics | Rating | Rank | Family Households |
| Latvians | 0.1 /100 | #287 | Tragic 62.8% |
| Immigrants | Uganda | 0.1 /100 | #288 | Tragic 62.7% |
| Immigrants | Nepal | 0.1 /100 | #289 | Tragic 62.7% |
| Immigrants | Grenada | 0.0 /100 | #290 | Tragic 62.6% |
| U.S. Virgin Islanders | 0.0 /100 | #291 | Tragic 62.6% |
| Immigrants | Burma/Myanmar | 0.0 /100 | #292 | Tragic 62.6% |
| Immigrants | Sweden | 0.0 /100 | #293 | Tragic 62.5% |
| Barbadians | 0.0 /100 | #294 | Tragic 62.5% |
| Okinawans | 0.0 /100 | #295 | Tragic 62.5% |
| Slovenes | 0.0 /100 | #296 | Tragic 62.4% |
| French American Indians | 0.0 /100 | #297 | Tragic 62.4% |
| Immigrants | Spain | 0.0 /100 | #298 | Tragic 62.4% |
| Immigrants | Kuwait | 0.0 /100 | #299 | Tragic 62.4% |
| Immigrants | Africa | 0.0 /100 | #300 | Tragic 62.4% |
| Immigrants | Albania | 0.0 /100 | #301 | Tragic 62.4% |