Canadian vs U.S. Virgin Islander Family Households
COMPARE
Canadian
U.S. Virgin Islander
Family Households
Family Households Comparison
Canadians
U.S. Virgin Islanders
64.4%
FAMILY HOUSEHOLDS
66.6/ 100
METRIC RATING
157th/ 347
METRIC RANK
62.6%
FAMILY HOUSEHOLDS
0.0/ 100
METRIC RATING
291st/ 347
METRIC RANK
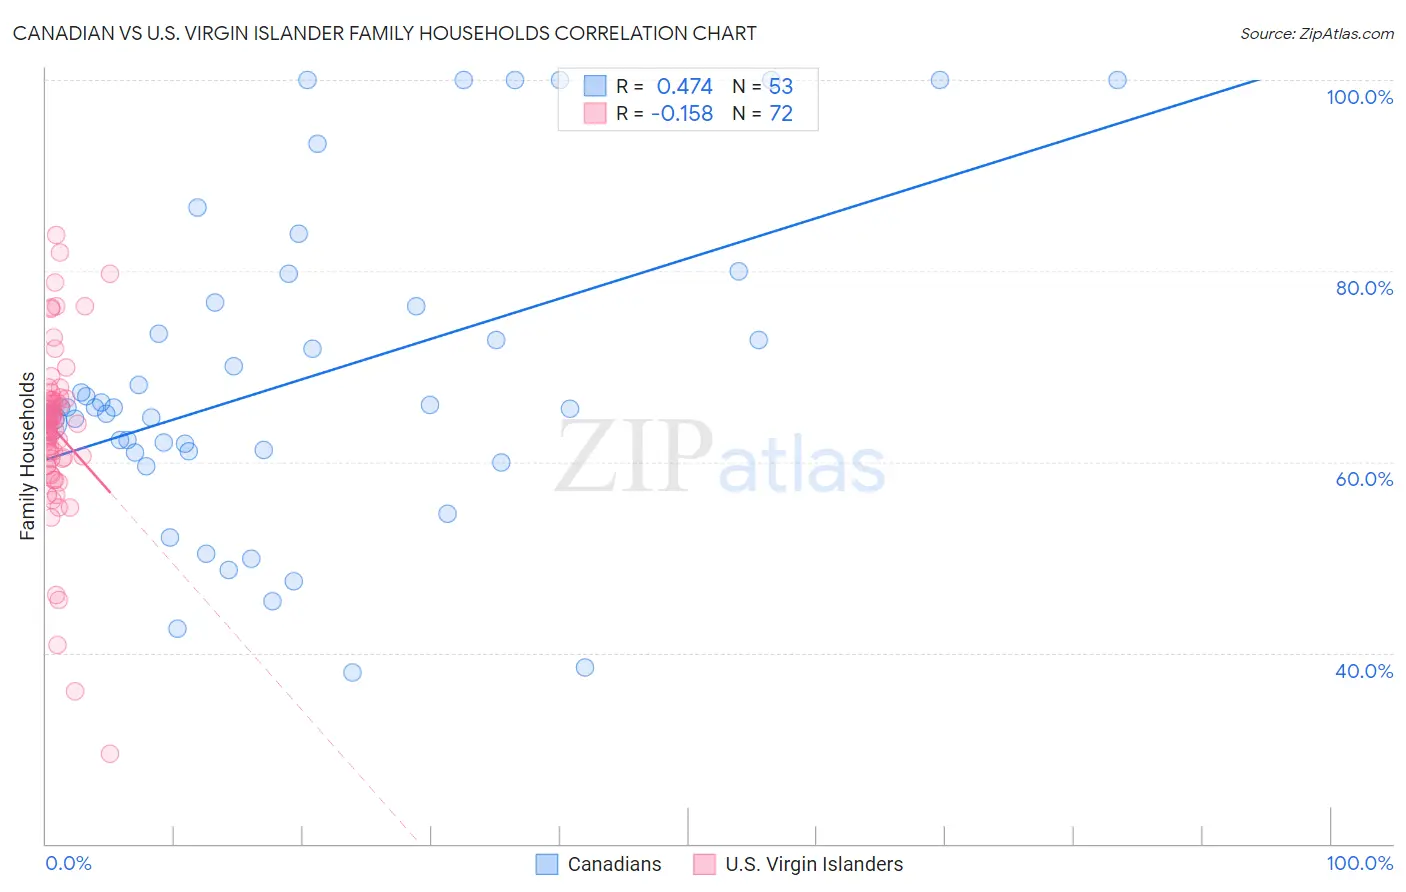
Canadian vs U.S. Virgin Islander Family Households Correlation Chart
The statistical analysis conducted on geographies consisting of 437,288,954 people shows a moderate positive correlation between the proportion of Canadians and percentage of family households in the United States with a correlation coefficient (R) of 0.474 and weighted average of 64.4%. Similarly, the statistical analysis conducted on geographies consisting of 87,507,759 people shows a poor negative correlation between the proportion of U.S. Virgin Islanders and percentage of family households in the United States with a correlation coefficient (R) of -0.158 and weighted average of 62.6%, a difference of 2.9%.
Family Households Correlation Summary
| Measurement | Canadian | U.S. Virgin Islander |
| Minimum | 38.0% | 29.5% |
| Maximum | 100.0% | 83.8% |
| Range | 62.0% | 54.3% |
| Mean | 68.7% | 63.2% |
| Median | 65.6% | 63.9% |
| Interquartile 25% (IQ1) | 61.0% | 59.9% |
| Interquartile 75% (IQ3) | 76.5% | 66.5% |
| Interquartile Range (IQR) | 15.5% | 6.6% |
| Standard Deviation (Sample) | 16.5% | 9.1% |
| Standard Deviation (Population) | 16.4% | 9.1% |
Similar Demographics by Family Households
Demographics Similar to Canadians by Family Households
In terms of family households, the demographic groups most similar to Canadians are Lebanese (64.4%, a difference of 0.0%), Czech (64.5%, a difference of 0.010%), German (64.4%, a difference of 0.010%), Uruguayan (64.5%, a difference of 0.020%), and Immigrants from Moldova (64.4%, a difference of 0.020%).
| Demographics | Rating | Rank | Family Households |
| Romanians | 75.3 /100 | #150 | Good 64.5% |
| Syrians | 75.2 /100 | #151 | Good 64.5% |
| Scottish | 70.9 /100 | #152 | Good 64.5% |
| Swedes | 69.8 /100 | #153 | Good 64.5% |
| Austrians | 68.5 /100 | #154 | Good 64.5% |
| Uruguayans | 67.7 /100 | #155 | Good 64.5% |
| Czechs | 67.0 /100 | #156 | Good 64.5% |
| Canadians | 66.6 /100 | #157 | Good 64.4% |
| Lebanese | 66.4 /100 | #158 | Good 64.4% |
| Germans | 65.8 /100 | #159 | Good 64.4% |
| Immigrants | Moldova | 65.2 /100 | #160 | Good 64.4% |
| Immigrants | England | 62.6 /100 | #161 | Good 64.4% |
| British | 61.6 /100 | #162 | Good 64.4% |
| Chickasaw | 61.5 /100 | #163 | Good 64.4% |
| Immigrants | Nigeria | 60.1 /100 | #164 | Good 64.4% |
Demographics Similar to U.S. Virgin Islanders by Family Households
In terms of family households, the demographic groups most similar to U.S. Virgin Islanders are Immigrants from Grenada (62.6%, a difference of 0.050%), Immigrants from Burma/Myanmar (62.6%, a difference of 0.050%), Immigrants from Nepal (62.7%, a difference of 0.13%), Immigrants from Sweden (62.5%, a difference of 0.18%), and Immigrants from Uganda (62.7%, a difference of 0.22%).
| Demographics | Rating | Rank | Family Households |
| Australians | 0.1 /100 | #284 | Tragic 62.8% |
| Mongolians | 0.1 /100 | #285 | Tragic 62.8% |
| British West Indians | 0.1 /100 | #286 | Tragic 62.8% |
| Latvians | 0.1 /100 | #287 | Tragic 62.8% |
| Immigrants | Uganda | 0.1 /100 | #288 | Tragic 62.7% |
| Immigrants | Nepal | 0.1 /100 | #289 | Tragic 62.7% |
| Immigrants | Grenada | 0.0 /100 | #290 | Tragic 62.6% |
| U.S. Virgin Islanders | 0.0 /100 | #291 | Tragic 62.6% |
| Immigrants | Burma/Myanmar | 0.0 /100 | #292 | Tragic 62.6% |
| Immigrants | Sweden | 0.0 /100 | #293 | Tragic 62.5% |
| Barbadians | 0.0 /100 | #294 | Tragic 62.5% |
| Okinawans | 0.0 /100 | #295 | Tragic 62.5% |
| Slovenes | 0.0 /100 | #296 | Tragic 62.4% |
| French American Indians | 0.0 /100 | #297 | Tragic 62.4% |
| Immigrants | Spain | 0.0 /100 | #298 | Tragic 62.4% |