Cherokee vs Immigrants from Greece Divorced or Separated
COMPARE
Cherokee
Immigrants from Greece
Divorced or Separated
Divorced or Separated Comparison
Cherokee
Immigrants from Greece
13.7%
DIVORCED OR SEPARATED
0.0/ 100
METRIC RATING
332nd/ 347
METRIC RANK
11.1%
DIVORCED OR SEPARATED
100.0/ 100
METRIC RATING
38th/ 347
METRIC RANK
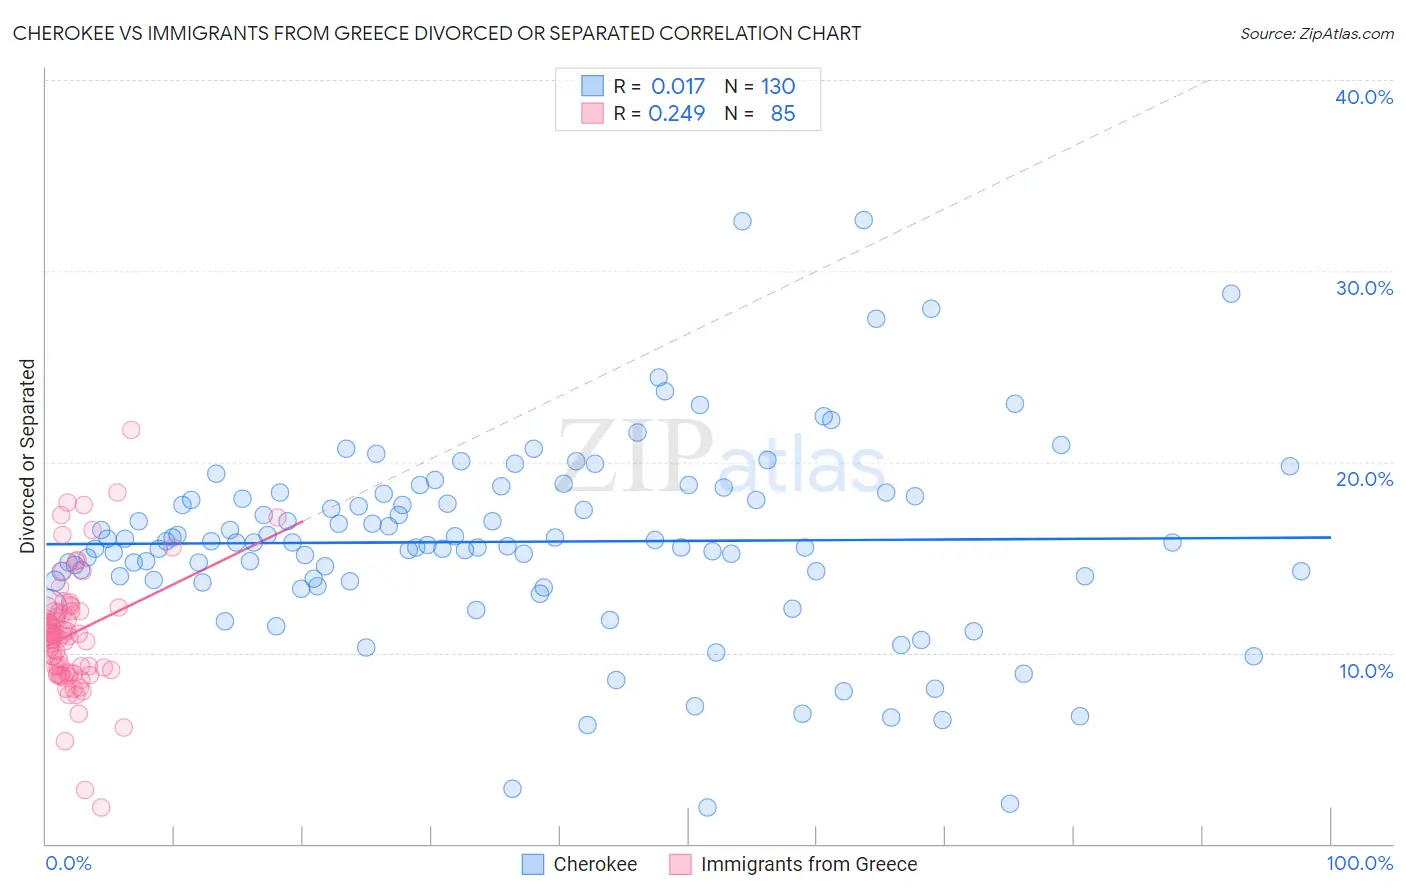
Cherokee vs Immigrants from Greece Divorced or Separated Correlation Chart
The statistical analysis conducted on geographies consisting of 493,555,088 people shows no correlation between the proportion of Cherokee and percentage of population currently divorced or separated in the United States with a correlation coefficient (R) of 0.017 and weighted average of 13.7%. Similarly, the statistical analysis conducted on geographies consisting of 216,866,276 people shows a weak positive correlation between the proportion of Immigrants from Greece and percentage of population currently divorced or separated in the United States with a correlation coefficient (R) of 0.249 and weighted average of 11.1%, a difference of 23.6%.
Divorced or Separated Correlation Summary
| Measurement | Cherokee | Immigrants from Greece |
| Minimum | 1.9% | 1.9% |
| Maximum | 32.7% | 21.7% |
| Range | 30.8% | 19.8% |
| Mean | 15.8% | 11.0% |
| Median | 15.8% | 10.9% |
| Interquartile 25% (IQ1) | 13.8% | 9.0% |
| Interquartile 75% (IQ3) | 18.2% | 12.2% |
| Interquartile Range (IQR) | 4.4% | 3.2% |
| Standard Deviation (Sample) | 5.1% | 3.2% |
| Standard Deviation (Population) | 5.1% | 3.2% |
Similar Demographics by Divorced or Separated
Demographics Similar to Cherokee by Divorced or Separated
In terms of divorced or separated, the demographic groups most similar to Cherokee are Black/African American (13.6%, a difference of 0.76%), Paiute (13.6%, a difference of 0.89%), Puerto Rican (13.9%, a difference of 0.95%), Houma (13.6%, a difference of 1.0%), and Immigrants from Caribbean (13.6%, a difference of 1.1%).
| Demographics | Rating | Rank | Divorced or Separated |
| Potawatomi | 0.0 /100 | #325 | Tragic 13.5% |
| Immigrants | Congo | 0.0 /100 | #326 | Tragic 13.5% |
| Comanche | 0.0 /100 | #327 | Tragic 13.5% |
| Immigrants | Caribbean | 0.0 /100 | #328 | Tragic 13.6% |
| Houma | 0.0 /100 | #329 | Tragic 13.6% |
| Paiute | 0.0 /100 | #330 | Tragic 13.6% |
| Blacks/African Americans | 0.0 /100 | #331 | Tragic 13.6% |
| Cherokee | 0.0 /100 | #332 | Tragic 13.7% |
| Puerto Ricans | 0.0 /100 | #333 | Tragic 13.9% |
| Immigrants | Bahamas | 0.0 /100 | #334 | Tragic 13.9% |
| Dutch West Indians | 0.0 /100 | #335 | Tragic 14.0% |
| Shoshone | 0.0 /100 | #336 | Tragic 14.0% |
| Crow | 0.0 /100 | #337 | Tragic 14.1% |
| Choctaw | 0.0 /100 | #338 | Tragic 14.1% |
| Colville | 0.0 /100 | #339 | Tragic 14.2% |
Demographics Similar to Immigrants from Greece by Divorced or Separated
In terms of divorced or separated, the demographic groups most similar to Immigrants from Greece are Immigrants from Lebanon (11.1%, a difference of 0.060%), Immigrants from Japan (11.1%, a difference of 0.070%), Cambodian (11.1%, a difference of 0.13%), Immigrants from Uzbekistan (11.1%, a difference of 0.21%), and Immigrants from Egypt (11.1%, a difference of 0.24%).
| Demographics | Rating | Rank | Divorced or Separated |
| Mongolians | 100.0 /100 | #31 | Exceptional 11.1% |
| Tongans | 100.0 /100 | #32 | Exceptional 11.1% |
| Egyptians | 100.0 /100 | #33 | Exceptional 11.1% |
| Immigrants | Uzbekistan | 100.0 /100 | #34 | Exceptional 11.1% |
| Cambodians | 100.0 /100 | #35 | Exceptional 11.1% |
| Immigrants | Japan | 100.0 /100 | #36 | Exceptional 11.1% |
| Immigrants | Lebanon | 100.0 /100 | #37 | Exceptional 11.1% |
| Immigrants | Greece | 100.0 /100 | #38 | Exceptional 11.1% |
| Immigrants | Egypt | 100.0 /100 | #39 | Exceptional 11.1% |
| Soviet Union | 100.0 /100 | #40 | Exceptional 11.1% |
| Bhutanese | 100.0 /100 | #41 | Exceptional 11.2% |
| Chinese | 100.0 /100 | #42 | Exceptional 11.2% |
| Immigrants | Belarus | 100.0 /100 | #43 | Exceptional 11.2% |
| Immigrants | Western Asia | 100.0 /100 | #44 | Exceptional 11.2% |
| Turks | 100.0 /100 | #45 | Exceptional 11.2% |