Finnish vs Czechoslovakian Single Mother Households
COMPARE
Finnish
Czechoslovakian
Single Mother Households
Single Mother Households Comparison
Finns
Czechoslovakians
5.7%
SINGLE MOTHER HOUSEHOLDS
97.6/ 100
METRIC RATING
86th/ 347
METRIC RANK
5.9%
SINGLE MOTHER HOUSEHOLDS
92.2/ 100
METRIC RATING
128th/ 347
METRIC RANK
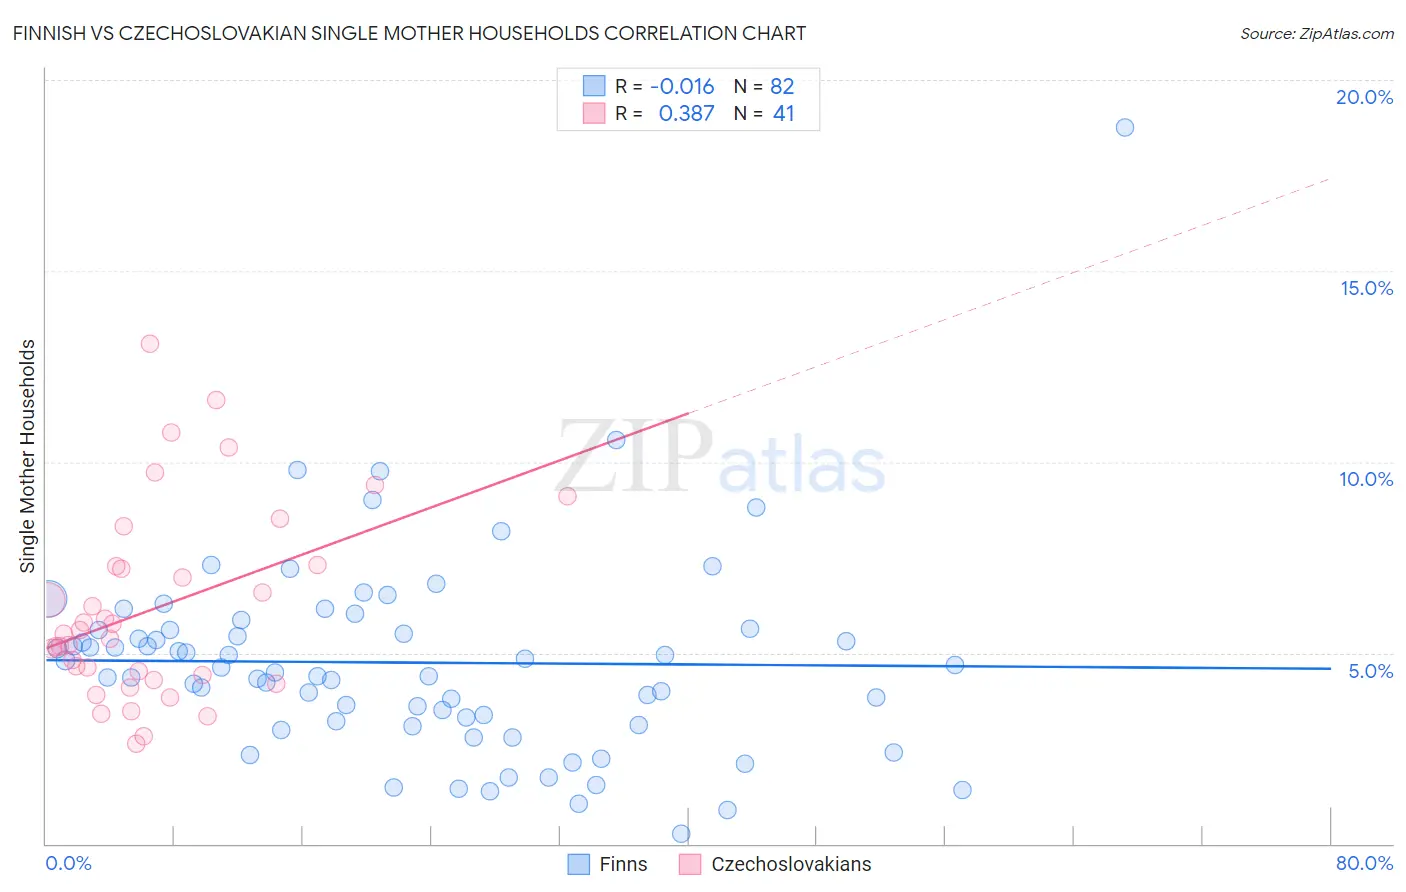
Finnish vs Czechoslovakian Single Mother Households Correlation Chart
The statistical analysis conducted on geographies consisting of 403,107,301 people shows no correlation between the proportion of Finns and percentage of single mother households in the United States with a correlation coefficient (R) of -0.016 and weighted average of 5.7%. Similarly, the statistical analysis conducted on geographies consisting of 367,454,114 people shows a mild positive correlation between the proportion of Czechoslovakians and percentage of single mother households in the United States with a correlation coefficient (R) of 0.387 and weighted average of 5.9%, a difference of 3.7%.
Single Mother Households Correlation Summary
| Measurement | Finnish | Czechoslovakian |
| Minimum | 0.26% | 2.6% |
| Maximum | 18.8% | 13.1% |
| Range | 18.5% | 10.5% |
| Mean | 4.7% | 6.2% |
| Median | 4.5% | 5.5% |
| Interquartile 25% (IQ1) | 3.2% | 4.3% |
| Interquartile 75% (IQ3) | 5.6% | 7.3% |
| Interquartile Range (IQR) | 2.4% | 2.9% |
| Standard Deviation (Sample) | 2.6% | 2.5% |
| Standard Deviation (Population) | 2.6% | 2.5% |
Similar Demographics by Single Mother Households
Demographics Similar to Finns by Single Mother Households
In terms of single mother households, the demographic groups most similar to Finns are Hungarian (5.7%, a difference of 0.030%), Immigrants from Turkey (5.7%, a difference of 0.080%), Israeli (5.7%, a difference of 0.15%), Carpatho Rusyn (5.7%, a difference of 0.18%), and Immigrants from Hungary (5.7%, a difference of 0.25%).
| Demographics | Rating | Rank | Single Mother Households |
| Immigrants | Sri Lanka | 98.0 /100 | #79 | Exceptional 5.6% |
| Czechs | 97.9 /100 | #80 | Exceptional 5.6% |
| Immigrants | Moldova | 97.9 /100 | #81 | Exceptional 5.6% |
| Immigrants | Malaysia | 97.8 /100 | #82 | Exceptional 5.7% |
| Immigrants | Hungary | 97.8 /100 | #83 | Exceptional 5.7% |
| Carpatho Rusyns | 97.7 /100 | #84 | Exceptional 5.7% |
| Hungarians | 97.6 /100 | #85 | Exceptional 5.7% |
| Finns | 97.6 /100 | #86 | Exceptional 5.7% |
| Immigrants | Turkey | 97.5 /100 | #87 | Exceptional 5.7% |
| Israelis | 97.4 /100 | #88 | Exceptional 5.7% |
| Ukrainians | 97.2 /100 | #89 | Exceptional 5.7% |
| Immigrants | Indonesia | 97.2 /100 | #90 | Exceptional 5.7% |
| Europeans | 97.0 /100 | #91 | Exceptional 5.7% |
| Immigrants | Western Asia | 96.7 /100 | #92 | Exceptional 5.7% |
| Serbians | 96.7 /100 | #93 | Exceptional 5.7% |
Demographics Similar to Czechoslovakians by Single Mother Households
In terms of single mother households, the demographic groups most similar to Czechoslovakians are Immigrants from Bolivia (5.9%, a difference of 0.010%), Palestinian (5.9%, a difference of 0.040%), Lebanese (5.9%, a difference of 0.080%), Welsh (5.9%, a difference of 0.27%), and Slavic (5.9%, a difference of 0.29%).
| Demographics | Rating | Rank | Single Mother Households |
| Argentineans | 93.7 /100 | #121 | Exceptional 5.8% |
| Belgians | 93.5 /100 | #122 | Exceptional 5.8% |
| Immigrants | Uzbekistan | 93.4 /100 | #123 | Exceptional 5.9% |
| Immigrants | Argentina | 93.2 /100 | #124 | Exceptional 5.9% |
| Slavs | 92.9 /100 | #125 | Exceptional 5.9% |
| Welsh | 92.8 /100 | #126 | Exceptional 5.9% |
| Lebanese | 92.4 /100 | #127 | Exceptional 5.9% |
| Czechoslovakians | 92.2 /100 | #128 | Exceptional 5.9% |
| Immigrants | Bolivia | 92.2 /100 | #129 | Exceptional 5.9% |
| Palestinians | 92.1 /100 | #130 | Exceptional 5.9% |
| Immigrants | Spain | 91.2 /100 | #131 | Exceptional 5.9% |
| Albanians | 91.1 /100 | #132 | Exceptional 5.9% |
| Egyptians | 90.7 /100 | #133 | Exceptional 5.9% |
| Canadians | 90.5 /100 | #134 | Exceptional 5.9% |
| Immigrants | Saudi Arabia | 90.2 /100 | #135 | Exceptional 5.9% |