Finnish vs Samoan Family Households
COMPARE
Finnish
Samoan
Family Households
Family Households Comparison
Finns
Samoans
63.5%
FAMILY HOUSEHOLDS
2.3/ 100
METRIC RATING
234th/ 347
METRIC RANK
67.9%
FAMILY HOUSEHOLDS
100.0/ 100
METRIC RATING
19th/ 347
METRIC RANK
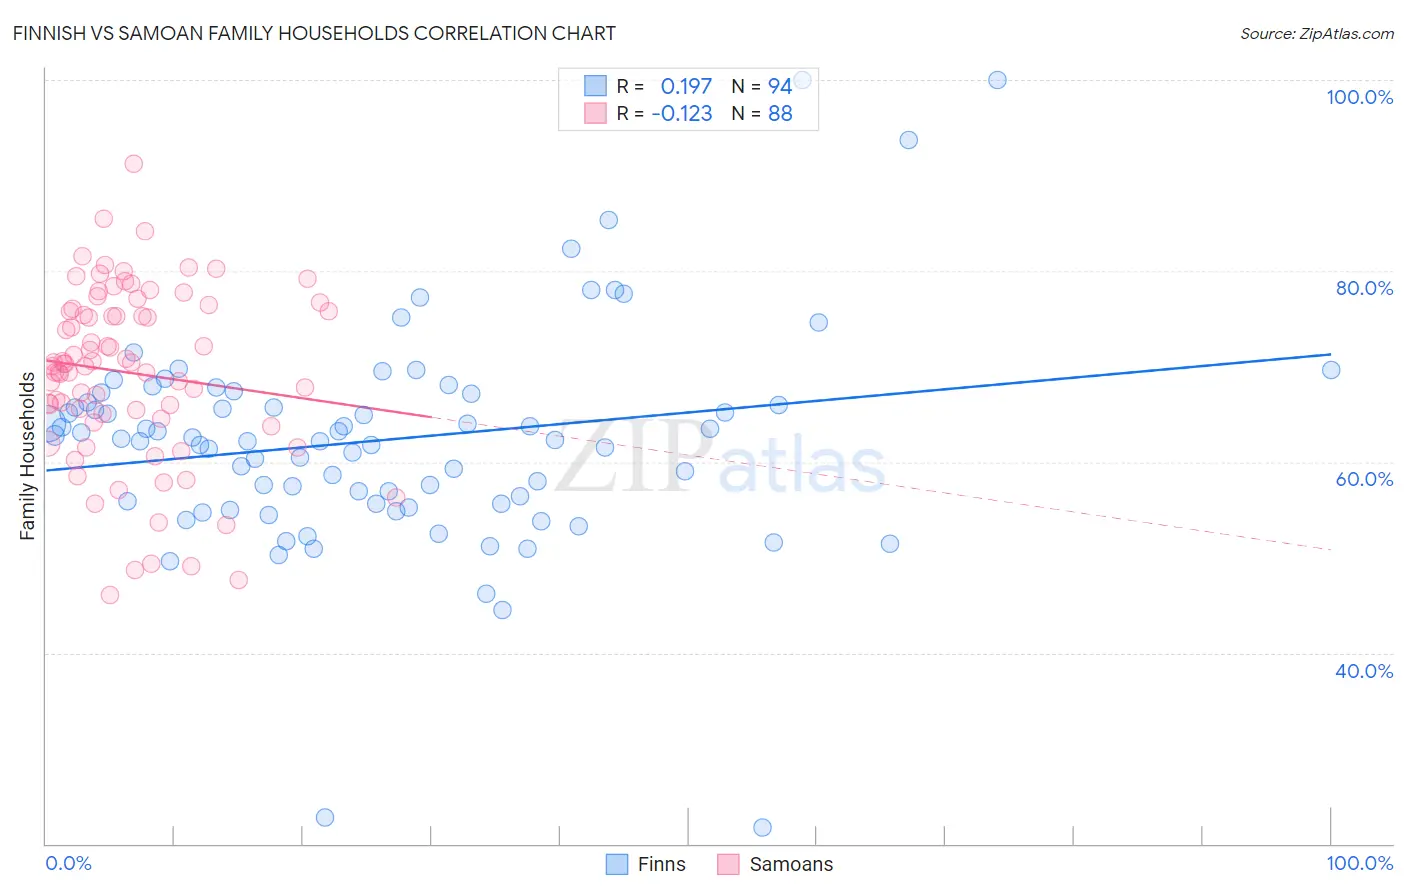
Finnish vs Samoan Family Households Correlation Chart
The statistical analysis conducted on geographies consisting of 404,508,203 people shows a poor positive correlation between the proportion of Finns and percentage of family households in the United States with a correlation coefficient (R) of 0.197 and weighted average of 63.5%. Similarly, the statistical analysis conducted on geographies consisting of 225,071,820 people shows a poor negative correlation between the proportion of Samoans and percentage of family households in the United States with a correlation coefficient (R) of -0.123 and weighted average of 67.9%, a difference of 7.0%.
Family Households Correlation Summary
| Measurement | Finnish | Samoan |
| Minimum | 21.6% | 46.0% |
| Maximum | 100.0% | 91.2% |
| Range | 78.4% | 45.2% |
| Mean | 62.3% | 69.3% |
| Median | 62.4% | 70.2% |
| Interquartile 25% (IQ1) | 55.6% | 64.8% |
| Interquartile 75% (IQ3) | 67.1% | 75.9% |
| Interquartile Range (IQR) | 11.5% | 11.1% |
| Standard Deviation (Sample) | 11.6% | 9.1% |
| Standard Deviation (Population) | 11.6% | 9.1% |
Similar Demographics by Family Households
Demographics Similar to Finns by Family Households
In terms of family households, the demographic groups most similar to Finns are Immigrants from Armenia (63.5%, a difference of 0.030%), Albanian (63.5%, a difference of 0.030%), Immigrants from Northern Africa (63.5%, a difference of 0.040%), Ghanaian (63.5%, a difference of 0.040%), and Comanche (63.5%, a difference of 0.040%).
| Demographics | Rating | Rank | Family Households |
| Trinidadians and Tobagonians | 4.1 /100 | #227 | Tragic 63.6% |
| Blackfeet | 3.6 /100 | #228 | Tragic 63.6% |
| Bulgarians | 3.4 /100 | #229 | Tragic 63.6% |
| Immigrants | Brazil | 3.0 /100 | #230 | Tragic 63.6% |
| Immigrants | Greece | 2.9 /100 | #231 | Tragic 63.5% |
| Immigrants | Northern Africa | 2.6 /100 | #232 | Tragic 63.5% |
| Immigrants | Armenia | 2.6 /100 | #233 | Tragic 63.5% |
| Finns | 2.3 /100 | #234 | Tragic 63.5% |
| Albanians | 2.2 /100 | #235 | Tragic 63.5% |
| Ghanaians | 2.1 /100 | #236 | Tragic 63.5% |
| Comanche | 2.1 /100 | #237 | Tragic 63.5% |
| Immigrants | Zimbabwe | 2.0 /100 | #238 | Tragic 63.5% |
| Aleuts | 1.9 /100 | #239 | Tragic 63.4% |
| South Africans | 1.9 /100 | #240 | Tragic 63.4% |
| Immigrants | St. Vincent and the Grenadines | 1.9 /100 | #241 | Tragic 63.4% |
Demographics Similar to Samoans by Family Households
In terms of family households, the demographic groups most similar to Samoans are Immigrants from Taiwan (68.0%, a difference of 0.12%), Inupiat (67.8%, a difference of 0.25%), Chinese (68.1%, a difference of 0.28%), Cuban (67.7%, a difference of 0.30%), and Assyrian/Chaldean/Syriac (68.2%, a difference of 0.32%).
| Demographics | Rating | Rank | Family Households |
| Koreans | 100.0 /100 | #12 | Exceptional 68.3% |
| Pueblo | 100.0 /100 | #13 | Exceptional 68.2% |
| Immigrants | Cuba | 100.0 /100 | #14 | Exceptional 68.2% |
| Assyrians/Chaldeans/Syriacs | 100.0 /100 | #15 | Exceptional 68.2% |
| Immigrants | Vietnam | 100.0 /100 | #16 | Exceptional 68.2% |
| Chinese | 100.0 /100 | #17 | Exceptional 68.1% |
| Immigrants | Taiwan | 100.0 /100 | #18 | Exceptional 68.0% |
| Samoans | 100.0 /100 | #19 | Exceptional 67.9% |
| Inupiat | 100.0 /100 | #20 | Exceptional 67.8% |
| Cubans | 100.0 /100 | #21 | Exceptional 67.7% |
| Sri Lankans | 100.0 /100 | #22 | Exceptional 67.7% |
| Immigrants | Pakistan | 100.0 /100 | #23 | Exceptional 67.7% |
| Immigrants | South Eastern Asia | 100.0 /100 | #24 | Exceptional 67.5% |
| Immigrants | Nicaragua | 100.0 /100 | #25 | Exceptional 67.5% |
| Immigrants | India | 100.0 /100 | #26 | Exceptional 67.4% |