Hispanic or Latino vs Immigrants from Saudi Arabia Currently Married
COMPARE
Hispanic or Latino
Immigrants from Saudi Arabia
Currently Married
Currently Married Comparison
Hispanics or Latinos
Immigrants from Saudi Arabia
44.1%
CURRENTLY MARRIED
0.3/ 100
METRIC RATING
252nd/ 347
METRIC RANK
44.7%
CURRENTLY MARRIED
1.1/ 100
METRIC RATING
233rd/ 347
METRIC RANK
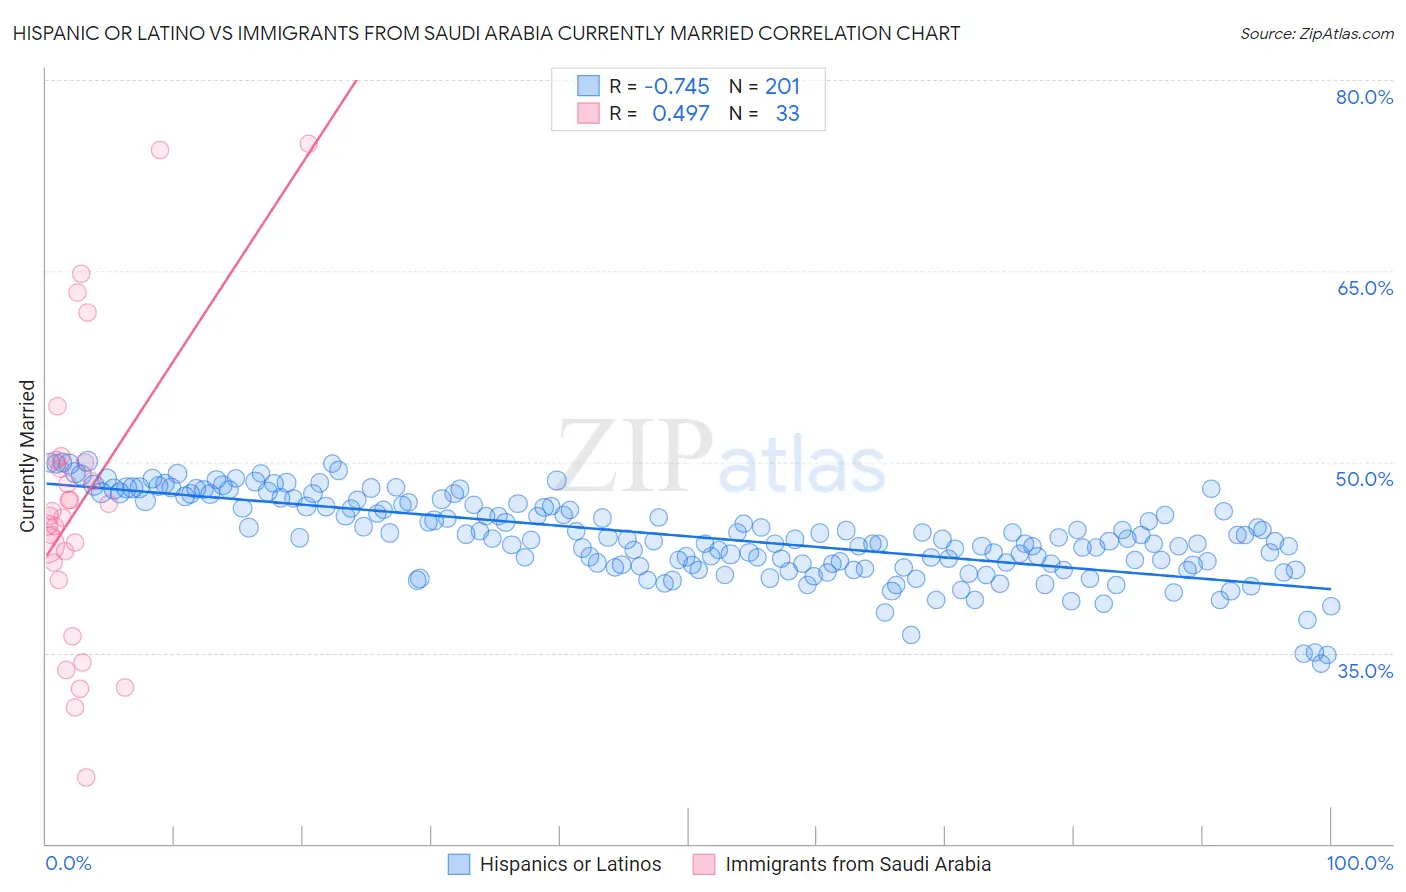
Hispanic or Latino vs Immigrants from Saudi Arabia Currently Married Correlation Chart
The statistical analysis conducted on geographies consisting of 578,461,581 people shows a strong negative correlation between the proportion of Hispanics or Latinos and percentage of population currently married in the United States with a correlation coefficient (R) of -0.745 and weighted average of 44.1%. Similarly, the statistical analysis conducted on geographies consisting of 164,277,877 people shows a moderate positive correlation between the proportion of Immigrants from Saudi Arabia and percentage of population currently married in the United States with a correlation coefficient (R) of 0.497 and weighted average of 44.7%, a difference of 1.3%.
Currently Married Correlation Summary
| Measurement | Hispanic or Latino | Immigrants from Saudi Arabia |
| Minimum | 34.1% | 25.2% |
| Maximum | 50.1% | 75.0% |
| Range | 16.0% | 49.8% |
| Mean | 44.1% | 46.7% |
| Median | 44.0% | 45.8% |
| Interquartile 25% (IQ1) | 42.0% | 41.4% |
| Interquartile 75% (IQ3) | 46.8% | 50.1% |
| Interquartile Range (IQR) | 4.8% | 8.7% |
| Standard Deviation (Sample) | 3.2% | 11.4% |
| Standard Deviation (Population) | 3.2% | 11.3% |
Demographics Similar to Hispanics or Latinos and Immigrants from Saudi Arabia by Currently Married
In terms of currently married, the demographic groups most similar to Hispanics or Latinos are Blackfeet (44.2%, a difference of 0.020%), Immigrants from Eastern Africa (44.2%, a difference of 0.080%), Immigrants from Cameroon (44.2%, a difference of 0.11%), Nicaraguan (44.2%, a difference of 0.12%), and Ugandan (44.2%, a difference of 0.21%). Similarly, the demographic groups most similar to Immigrants from Saudi Arabia are Iroquois (44.7%, a difference of 0.010%), Nepalese (44.7%, a difference of 0.050%), Alaskan Athabascan (44.6%, a difference of 0.16%), Cuban (44.6%, a difference of 0.17%), and Seminole (44.6%, a difference of 0.18%).
| Demographics | Rating | Rank | Currently Married |
| Nepalese | 1.2 /100 | #232 | Tragic 44.7% |
| Immigrants | Saudi Arabia | 1.1 /100 | #233 | Tragic 44.7% |
| Iroquois | 1.1 /100 | #234 | Tragic 44.7% |
| Alaskan Athabascans | 0.9 /100 | #235 | Tragic 44.6% |
| Cubans | 0.9 /100 | #236 | Tragic 44.6% |
| Seminole | 0.9 /100 | #237 | Tragic 44.6% |
| Moroccans | 0.9 /100 | #238 | Tragic 44.6% |
| Immigrants | Mexico | 0.7 /100 | #239 | Tragic 44.5% |
| Mexican American Indians | 0.7 /100 | #240 | Tragic 44.5% |
| Ethiopians | 0.7 /100 | #241 | Tragic 44.5% |
| Immigrants | Cambodia | 0.7 /100 | #242 | Tragic 44.5% |
| Immigrants | Ethiopia | 0.7 /100 | #243 | Tragic 44.5% |
| Japanese | 0.6 /100 | #244 | Tragic 44.5% |
| Immigrants | Armenia | 0.4 /100 | #245 | Tragic 44.3% |
| Immigrants | Burma/Myanmar | 0.4 /100 | #246 | Tragic 44.3% |
| Ugandans | 0.4 /100 | #247 | Tragic 44.2% |
| Nicaraguans | 0.3 /100 | #248 | Tragic 44.2% |
| Immigrants | Cameroon | 0.3 /100 | #249 | Tragic 44.2% |
| Immigrants | Eastern Africa | 0.3 /100 | #250 | Tragic 44.2% |
| Blackfeet | 0.3 /100 | #251 | Tragic 44.2% |
| Hispanics or Latinos | 0.3 /100 | #252 | Tragic 44.1% |