Immigrants from Albania vs Pennsylvania German Births to Unmarried Women
COMPARE
Immigrants from Albania
Pennsylvania German
Births to Unmarried Women
Births to Unmarried Women Comparison
Immigrants from Albania
Pennsylvania Germans
28.0%
BIRTHS TO UNMARRIED WOMEN
99.2/ 100
METRIC RATING
58th/ 347
METRIC RANK
34.0%
BIRTHS TO UNMARRIED WOMEN
4.3/ 100
METRIC RATING
223rd/ 347
METRIC RANK
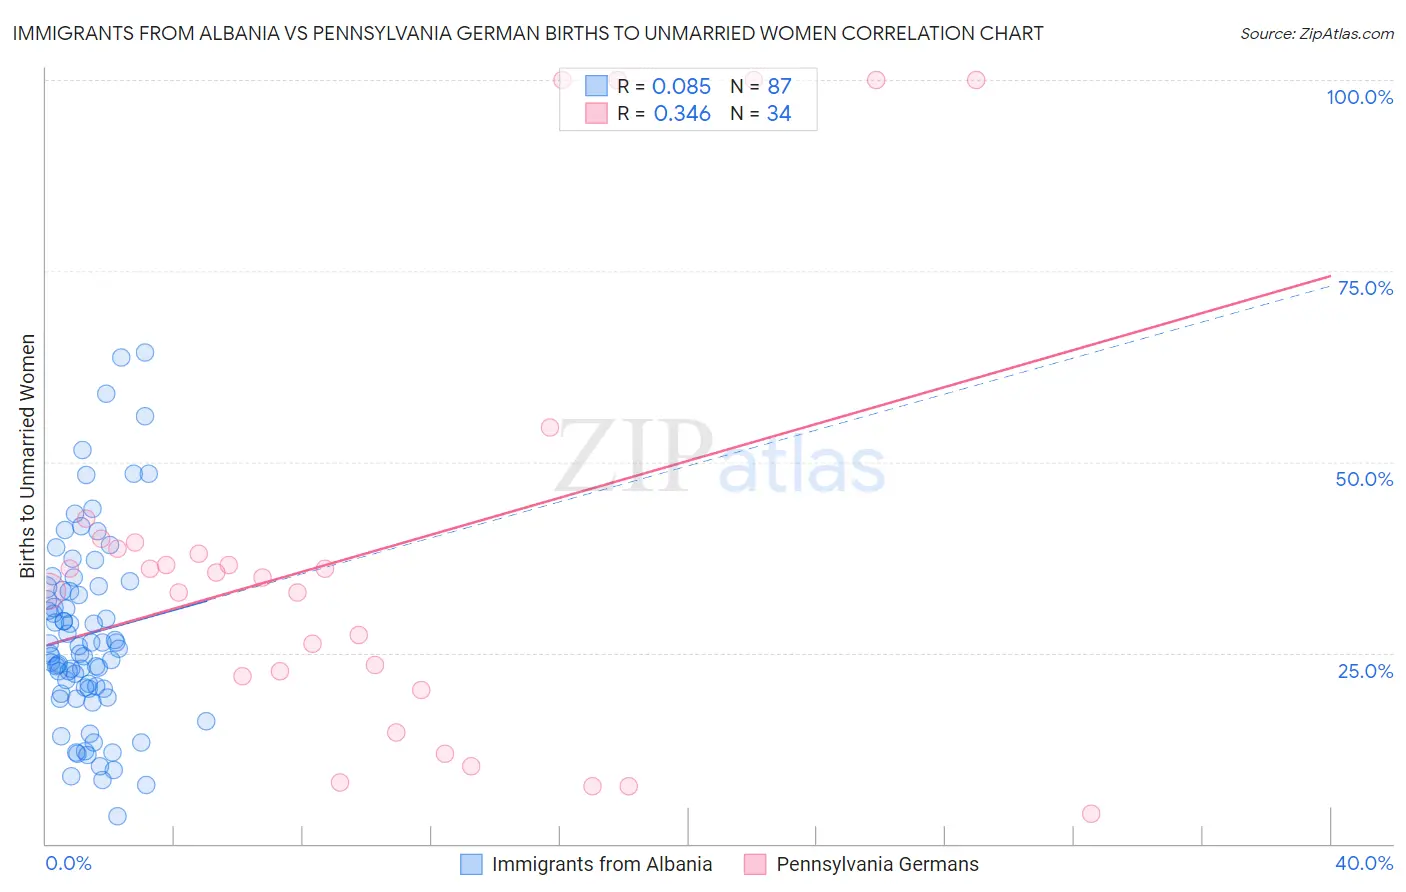
Immigrants from Albania vs Pennsylvania German Births to Unmarried Women Correlation Chart
The statistical analysis conducted on geographies consisting of 114,601,314 people shows a slight positive correlation between the proportion of Immigrants from Albania and percentage of births to unmarried women in the United States with a correlation coefficient (R) of 0.085 and weighted average of 28.0%. Similarly, the statistical analysis conducted on geographies consisting of 220,469,063 people shows a mild positive correlation between the proportion of Pennsylvania Germans and percentage of births to unmarried women in the United States with a correlation coefficient (R) of 0.346 and weighted average of 34.0%, a difference of 21.2%.
Births to Unmarried Women Correlation Summary
| Measurement | Immigrants from Albania | Pennsylvania German |
| Minimum | 3.6% | 4.0% |
| Maximum | 64.4% | 100.0% |
| Range | 60.8% | 96.0% |
| Mean | 27.4% | 38.5% |
| Median | 25.6% | 35.2% |
| Interquartile 25% (IQ1) | 20.3% | 21.9% |
| Interquartile 75% (IQ3) | 33.6% | 39.5% |
| Interquartile Range (IQR) | 13.3% | 17.6% |
| Standard Deviation (Sample) | 12.6% | 28.5% |
| Standard Deviation (Population) | 12.5% | 28.1% |
Similar Demographics by Births to Unmarried Women
Demographics Similar to Immigrants from Albania by Births to Unmarried Women
In terms of births to unmarried women, the demographic groups most similar to Immigrants from Albania are Russian (28.0%, a difference of 0.11%), Immigrants from Belgium (28.0%, a difference of 0.24%), Immigrants from Kazakhstan (28.1%, a difference of 0.25%), Immigrants from Turkey (28.1%, a difference of 0.29%), and Immigrants from North Macedonia (28.1%, a difference of 0.34%).
| Demographics | Rating | Rank | Births to Unmarried Women |
| Macedonians | 99.4 /100 | #51 | Exceptional 27.9% |
| Bhutanese | 99.4 /100 | #52 | Exceptional 27.9% |
| Immigrants | Romania | 99.4 /100 | #53 | Exceptional 27.9% |
| Afghans | 99.4 /100 | #54 | Exceptional 27.9% |
| Mongolians | 99.3 /100 | #55 | Exceptional 27.9% |
| Immigrants | Belgium | 99.3 /100 | #56 | Exceptional 28.0% |
| Russians | 99.2 /100 | #57 | Exceptional 28.0% |
| Immigrants | Albania | 99.2 /100 | #58 | Exceptional 28.0% |
| Immigrants | Kazakhstan | 99.1 /100 | #59 | Exceptional 28.1% |
| Immigrants | Turkey | 99.1 /100 | #60 | Exceptional 28.1% |
| Immigrants | North Macedonia | 99.1 /100 | #61 | Exceptional 28.1% |
| Egyptians | 99.0 /100 | #62 | Exceptional 28.2% |
| Immigrants | Serbia | 98.9 /100 | #63 | Exceptional 28.3% |
| Tongans | 98.8 /100 | #64 | Exceptional 28.4% |
| Immigrants | Czechoslovakia | 98.8 /100 | #65 | Exceptional 28.4% |
Demographics Similar to Pennsylvania Germans by Births to Unmarried Women
In terms of births to unmarried women, the demographic groups most similar to Pennsylvania Germans are Immigrants from Laos (34.0%, a difference of 0.0%), Spanish (34.1%, a difference of 0.17%), Immigrants from Uruguay (33.9%, a difference of 0.29%), Malaysian (33.9%, a difference of 0.35%), and Portuguese (33.8%, a difference of 0.53%).
| Demographics | Rating | Rank | Births to Unmarried Women |
| Nepalese | 7.8 /100 | #216 | Tragic 33.5% |
| Spaniards | 7.0 /100 | #217 | Tragic 33.6% |
| Immigrants | Ecuador | 5.9 /100 | #218 | Tragic 33.7% |
| Alsatians | 5.4 /100 | #219 | Tragic 33.8% |
| Portuguese | 5.4 /100 | #220 | Tragic 33.8% |
| Malaysians | 5.0 /100 | #221 | Tragic 33.9% |
| Immigrants | Uruguay | 4.8 /100 | #222 | Tragic 33.9% |
| Pennsylvania Germans | 4.3 /100 | #223 | Tragic 34.0% |
| Immigrants | Laos | 4.3 /100 | #224 | Tragic 34.0% |
| Spanish | 4.0 /100 | #225 | Tragic 34.1% |
| Delaware | 3.3 /100 | #226 | Tragic 34.2% |
| Immigrants | Panama | 3.3 /100 | #227 | Tragic 34.2% |
| Panamanians | 3.3 /100 | #228 | Tragic 34.2% |
| Immigrants | Sierra Leone | 3.1 /100 | #229 | Tragic 34.2% |
| Ghanaians | 3.1 /100 | #230 | Tragic 34.3% |