Immigrants from Austria vs Okinawan Divorced or Separated
COMPARE
Immigrants from Austria
Okinawan
Divorced or Separated
Divorced or Separated Comparison
Immigrants from Austria
Okinawans
11.8%
DIVORCED OR SEPARATED
88.2/ 100
METRIC RATING
130th/ 347
METRIC RANK
10.5%
DIVORCED OR SEPARATED
100.0/ 100
METRIC RATING
12th/ 347
METRIC RANK
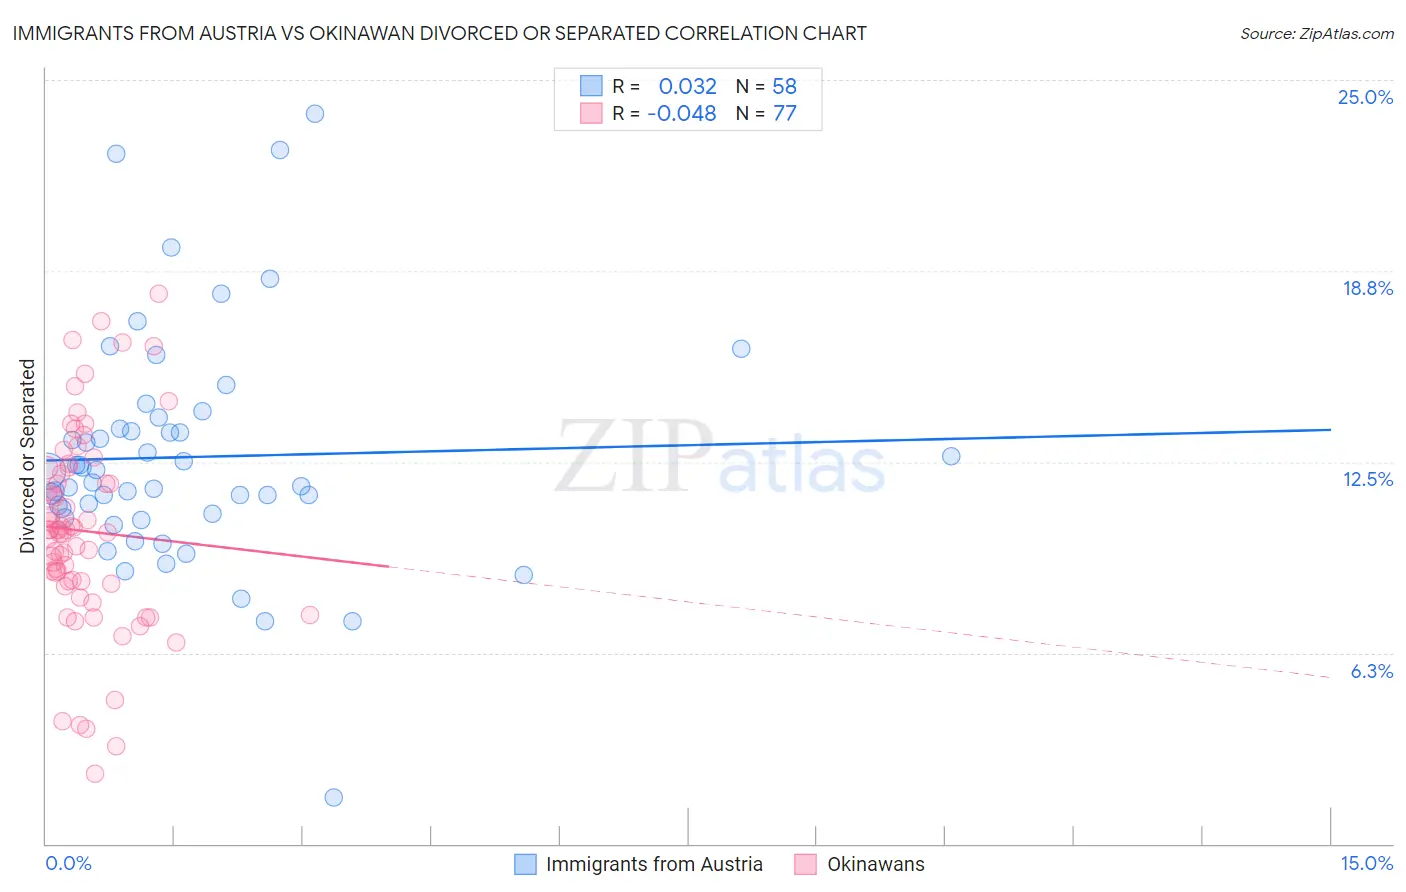
Immigrants from Austria vs Okinawan Divorced or Separated Correlation Chart
The statistical analysis conducted on geographies consisting of 167,967,636 people shows no correlation between the proportion of Immigrants from Austria and percentage of population currently divorced or separated in the United States with a correlation coefficient (R) of 0.032 and weighted average of 11.8%. Similarly, the statistical analysis conducted on geographies consisting of 73,753,188 people shows no correlation between the proportion of Okinawans and percentage of population currently divorced or separated in the United States with a correlation coefficient (R) of -0.048 and weighted average of 10.5%, a difference of 13.2%.
Divorced or Separated Correlation Summary
| Measurement | Immigrants from Austria | Okinawan |
| Minimum | 1.5% | 2.3% |
| Maximum | 23.9% | 18.0% |
| Range | 22.4% | 15.7% |
| Mean | 12.7% | 10.2% |
| Median | 12.0% | 10.3% |
| Interquartile 25% (IQ1) | 10.8% | 8.5% |
| Interquartile 75% (IQ3) | 13.6% | 12.2% |
| Interquartile Range (IQR) | 2.8% | 3.7% |
| Standard Deviation (Sample) | 3.8% | 3.2% |
| Standard Deviation (Population) | 3.8% | 3.2% |
Similar Demographics by Divorced or Separated
Demographics Similar to Immigrants from Austria by Divorced or Separated
In terms of divorced or separated, the demographic groups most similar to Immigrants from Austria are Immigrants from Cambodia (11.8%, a difference of 0.0%), Immigrants from St. Vincent and the Grenadines (11.8%, a difference of 0.010%), Immigrants from Afghanistan (11.8%, a difference of 0.030%), Immigrants from Ecuador (11.8%, a difference of 0.050%), and South African (11.8%, a difference of 0.060%).
| Demographics | Rating | Rank | Divorced or Separated |
| Immigrants | Immigrants | 93.7 /100 | #123 | Exceptional 11.8% |
| Ugandans | 93.1 /100 | #124 | Exceptional 11.8% |
| Ukrainians | 92.3 /100 | #125 | Exceptional 11.8% |
| South American Indians | 92.1 /100 | #126 | Exceptional 11.8% |
| South Africans | 88.9 /100 | #127 | Excellent 11.8% |
| Immigrants | Ecuador | 88.9 /100 | #128 | Excellent 11.8% |
| Immigrants | St. Vincent and the Grenadines | 88.4 /100 | #129 | Excellent 11.8% |
| Immigrants | Austria | 88.2 /100 | #130 | Excellent 11.8% |
| Immigrants | Cambodia | 88.2 /100 | #131 | Excellent 11.8% |
| Immigrants | Afghanistan | 87.9 /100 | #132 | Excellent 11.8% |
| New Zealanders | 87.5 /100 | #133 | Excellent 11.9% |
| Argentineans | 85.1 /100 | #134 | Excellent 11.9% |
| Danes | 84.8 /100 | #135 | Excellent 11.9% |
| Carpatho Rusyns | 84.8 /100 | #136 | Excellent 11.9% |
| Alsatians | 84.0 /100 | #137 | Excellent 11.9% |
Demographics Similar to Okinawans by Divorced or Separated
In terms of divorced or separated, the demographic groups most similar to Okinawans are Cypriot (10.5%, a difference of 0.16%), Immigrants from South Central Asia (10.4%, a difference of 0.34%), Assyrian/Chaldean/Syriac (10.6%, a difference of 0.90%), Immigrants from Armenia (10.6%, a difference of 0.97%), and Immigrants from Singapore (10.3%, a difference of 1.3%).
| Demographics | Rating | Rank | Divorced or Separated |
| Immigrants | India | 100.0 /100 | #5 | Exceptional 10.1% |
| Indians (Asian) | 100.0 /100 | #6 | Exceptional 10.2% |
| Thais | 100.0 /100 | #7 | Exceptional 10.2% |
| Immigrants | Eastern Asia | 100.0 /100 | #8 | Exceptional 10.2% |
| Yup'ik | 100.0 /100 | #9 | Exceptional 10.3% |
| Immigrants | Singapore | 100.0 /100 | #10 | Exceptional 10.3% |
| Immigrants | South Central Asia | 100.0 /100 | #11 | Exceptional 10.4% |
| Okinawans | 100.0 /100 | #12 | Exceptional 10.5% |
| Cypriots | 100.0 /100 | #13 | Exceptional 10.5% |
| Assyrians/Chaldeans/Syriacs | 100.0 /100 | #14 | Exceptional 10.6% |
| Immigrants | Armenia | 100.0 /100 | #15 | Exceptional 10.6% |
| Immigrants | Korea | 100.0 /100 | #16 | Exceptional 10.6% |
| Immigrants | Israel | 100.0 /100 | #17 | Exceptional 10.6% |
| Immigrants | Iran | 100.0 /100 | #18 | Exceptional 10.6% |
| Asians | 100.0 /100 | #19 | Exceptional 10.6% |