Immigrants from Costa Rica vs Immigrants from Southern Europe Average Family Size
COMPARE
Immigrants from Costa Rica
Immigrants from Southern Europe
Average Family Size
Average Family Size Comparison
Immigrants from Costa Rica
Immigrants from Southern Europe
3.26
AVERAGE FAMILY SIZE
90.7/ 100
METRIC RATING
126th/ 347
METRIC RANK
3.18
AVERAGE FAMILY SIZE
2.9/ 100
METRIC RATING
244th/ 347
METRIC RANK
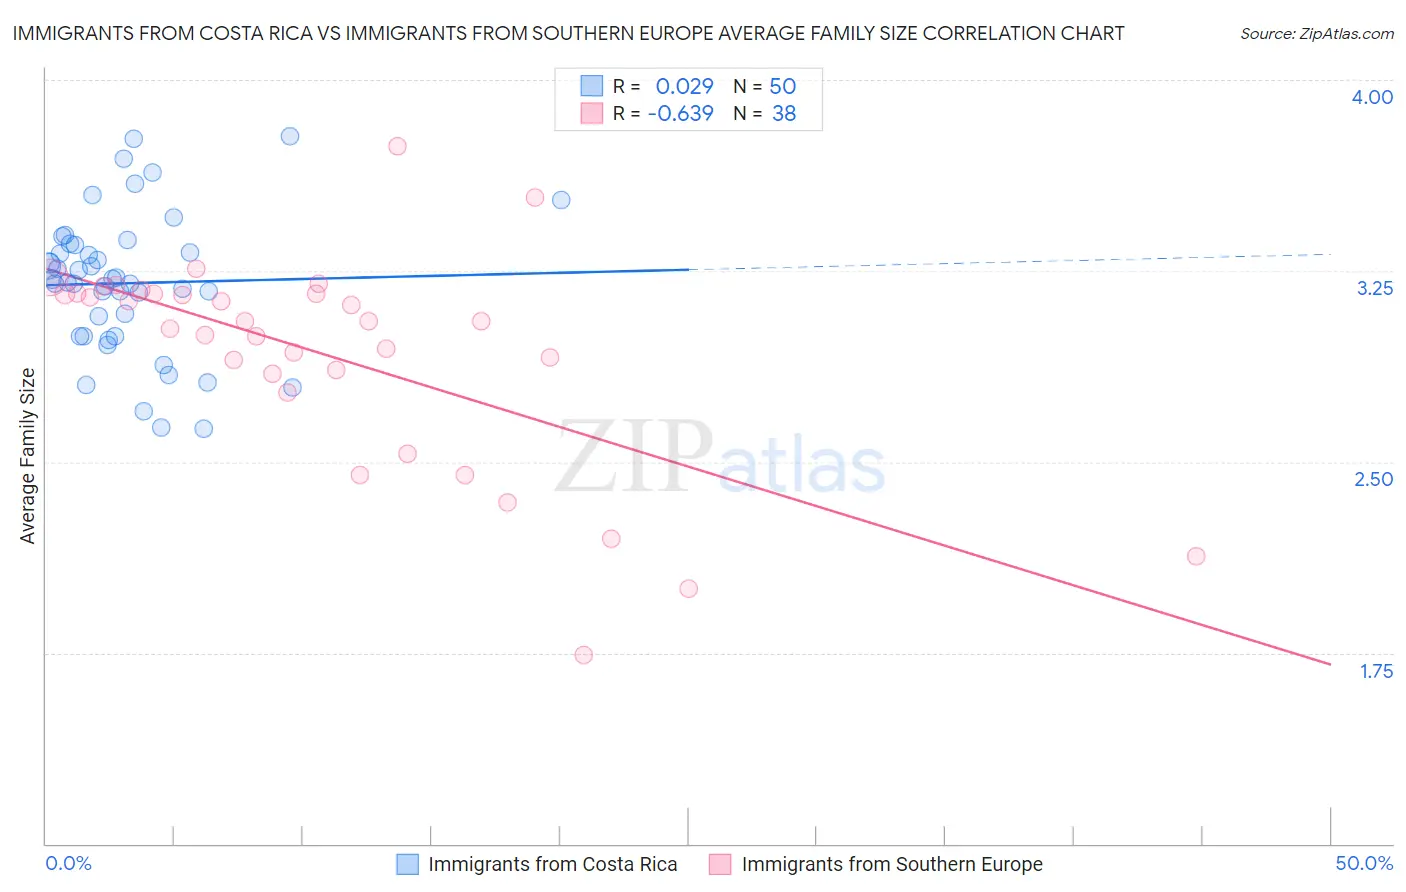
Immigrants from Costa Rica vs Immigrants from Southern Europe Average Family Size Correlation Chart
The statistical analysis conducted on geographies consisting of 204,251,224 people shows no correlation between the proportion of Immigrants from Costa Rica and average family size in the United States with a correlation coefficient (R) of 0.029 and weighted average of 3.26. Similarly, the statistical analysis conducted on geographies consisting of 402,630,009 people shows a significant negative correlation between the proportion of Immigrants from Southern Europe and average family size in the United States with a correlation coefficient (R) of -0.639 and weighted average of 3.18, a difference of 2.7%.
Average Family Size Correlation Summary
| Measurement | Immigrants from Costa Rica | Immigrants from Southern Europe |
| Minimum | 2.63 | 1.74 |
| Maximum | 3.78 | 3.74 |
| Range | 1.15 | 2.00 |
| Mean | 3.20 | 2.92 |
| Median | 3.21 | 3.05 |
| Interquartile 25% (IQ1) | 2.99 | 2.85 |
| Interquartile 75% (IQ3) | 3.35 | 3.16 |
| Interquartile Range (IQR) | 0.36 | 0.32 |
| Standard Deviation (Sample) | 0.27 | 0.42 |
| Standard Deviation (Population) | 0.27 | 0.41 |
Similar Demographics by Average Family Size
Demographics Similar to Immigrants from Costa Rica by Average Family Size
In terms of average family size, the demographic groups most similar to Immigrants from Costa Rica are Immigrants from Syria (3.26, a difference of 0.010%), Immigrants from Cuba (3.26, a difference of 0.030%), Colombian (3.26, a difference of 0.040%), South American Indian (3.26, a difference of 0.050%), and Alaskan Athabascan (3.27, a difference of 0.10%).
| Demographics | Rating | Rank | Average Family Size |
| Immigrants | Indonesia | 93.7 /100 | #119 | Exceptional 3.27 |
| Immigrants | Bahamas | 93.6 /100 | #120 | Exceptional 3.27 |
| Immigrants | Thailand | 93.3 /100 | #121 | Exceptional 3.27 |
| Immigrants | Colombia | 92.8 /100 | #122 | Exceptional 3.27 |
| Alaskan Athabascans | 92.4 /100 | #123 | Exceptional 3.27 |
| South American Indians | 91.6 /100 | #124 | Exceptional 3.26 |
| Immigrants | Cuba | 91.3 /100 | #125 | Exceptional 3.26 |
| Immigrants | Costa Rica | 90.7 /100 | #126 | Exceptional 3.26 |
| Immigrants | Syria | 90.6 /100 | #127 | Exceptional 3.26 |
| Colombians | 89.9 /100 | #128 | Excellent 3.26 |
| Immigrants | Hong Kong | 88.6 /100 | #129 | Excellent 3.26 |
| Laotians | 88.5 /100 | #130 | Excellent 3.26 |
| Immigrants | Western Asia | 87.7 /100 | #131 | Excellent 3.26 |
| Costa Ricans | 86.8 /100 | #132 | Excellent 3.26 |
| Immigrants | Venezuela | 86.3 /100 | #133 | Excellent 3.26 |
Demographics Similar to Immigrants from Southern Europe by Average Family Size
In terms of average family size, the demographic groups most similar to Immigrants from Southern Europe are Hungarian (3.18, a difference of 0.010%), Immigrants from Moldova (3.18, a difference of 0.010%), Immigrants from Japan (3.18, a difference of 0.030%), Immigrants from Brazil (3.18, a difference of 0.030%), and Osage (3.18, a difference of 0.050%).
| Demographics | Rating | Rank | Average Family Size |
| Immigrants | Romania | 3.7 /100 | #237 | Tragic 3.18 |
| Romanians | 3.7 /100 | #238 | Tragic 3.18 |
| Houma | 3.4 /100 | #239 | Tragic 3.18 |
| Osage | 3.2 /100 | #240 | Tragic 3.18 |
| Immigrants | Japan | 3.0 /100 | #241 | Tragic 3.18 |
| Hungarians | 3.0 /100 | #242 | Tragic 3.18 |
| Immigrants | Moldova | 2.9 /100 | #243 | Tragic 3.18 |
| Immigrants | Southern Europe | 2.9 /100 | #244 | Tragic 3.18 |
| Immigrants | Brazil | 2.7 /100 | #245 | Tragic 3.18 |
| Danes | 2.5 /100 | #246 | Tragic 3.17 |
| Cajuns | 2.4 /100 | #247 | Tragic 3.17 |
| Immigrants | Belarus | 2.3 /100 | #248 | Tragic 3.17 |
| Immigrants | Eastern Europe | 2.1 /100 | #249 | Tragic 3.17 |
| Puget Sound Salish | 1.9 /100 | #250 | Tragic 3.17 |
| Immigrants | Spain | 1.8 /100 | #251 | Tragic 3.17 |