Immigrants from Egypt vs Nicaraguan Family Households
COMPARE
Immigrants from Egypt
Nicaraguan
Family Households
Family Households Comparison
Immigrants from Egypt
Nicaraguans
65.3%
FAMILY HOUSEHOLDS
99.2/ 100
METRIC RATING
87th/ 347
METRIC RANK
67.4%
FAMILY HOUSEHOLDS
100.0/ 100
METRIC RATING
29th/ 347
METRIC RANK
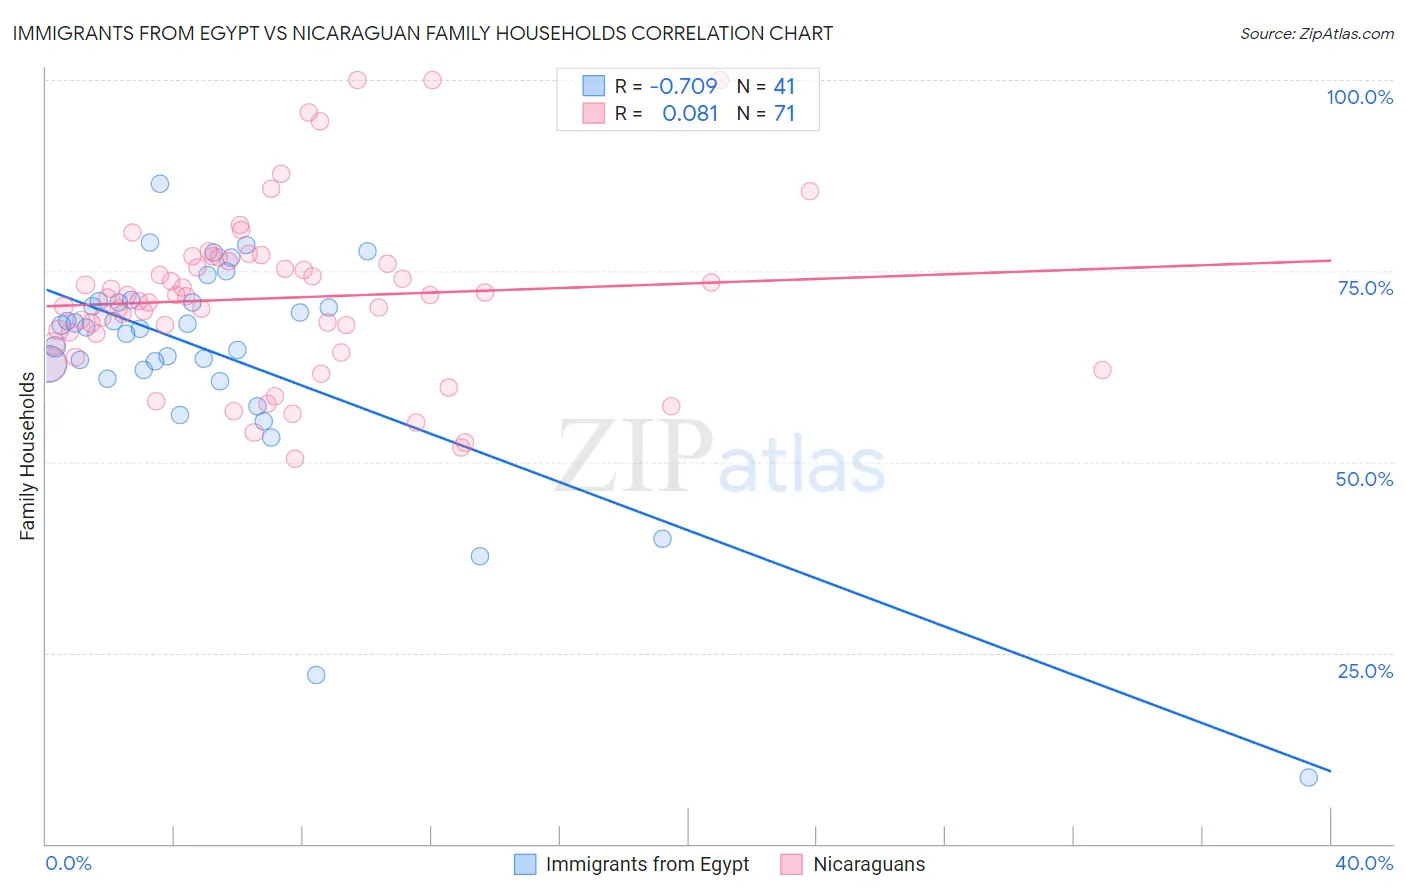
Immigrants from Egypt vs Nicaraguan Family Households Correlation Chart
The statistical analysis conducted on geographies consisting of 245,430,680 people shows a strong negative correlation between the proportion of Immigrants from Egypt and percentage of family households in the United States with a correlation coefficient (R) of -0.709 and weighted average of 65.3%. Similarly, the statistical analysis conducted on geographies consisting of 285,625,723 people shows a slight positive correlation between the proportion of Nicaraguans and percentage of family households in the United States with a correlation coefficient (R) of 0.081 and weighted average of 67.4%, a difference of 3.1%.
Family Households Correlation Summary
| Measurement | Immigrants from Egypt | Nicaraguan |
| Minimum | 8.7% | 50.4% |
| Maximum | 86.5% | 100.0% |
| Range | 77.8% | 49.6% |
| Mean | 64.0% | 71.4% |
| Median | 67.6% | 71.5% |
| Interquartile 25% (IQ1) | 61.5% | 65.5% |
| Interquartile 75% (IQ3) | 71.0% | 76.3% |
| Interquartile Range (IQR) | 9.5% | 10.8% |
| Standard Deviation (Sample) | 14.6% | 11.0% |
| Standard Deviation (Population) | 14.4% | 10.9% |
Similar Demographics by Family Households
Demographics Similar to Immigrants from Egypt by Family Households
In terms of family households, the demographic groups most similar to Immigrants from Egypt are Immigrants from Haiti (65.3%, a difference of 0.030%), Immigrants from Caribbean (65.3%, a difference of 0.040%), Immigrants from Laos (65.3%, a difference of 0.050%), Egyptian (65.4%, a difference of 0.090%), and Crow (65.3%, a difference of 0.10%).
| Demographics | Rating | Rank | Family Households |
| Puget Sound Salish | 99.8 /100 | #80 | Exceptional 65.6% |
| Jordanians | 99.7 /100 | #81 | Exceptional 65.5% |
| Immigrants | Lebanon | 99.7 /100 | #82 | Exceptional 65.5% |
| Immigrants | Guyana | 99.6 /100 | #83 | Exceptional 65.5% |
| Americans | 99.6 /100 | #84 | Exceptional 65.5% |
| Immigrants | Cambodia | 99.5 /100 | #85 | Exceptional 65.4% |
| Egyptians | 99.4 /100 | #86 | Exceptional 65.4% |
| Immigrants | Egypt | 99.2 /100 | #87 | Exceptional 65.3% |
| Immigrants | Haiti | 99.1 /100 | #88 | Exceptional 65.3% |
| Immigrants | Caribbean | 99.1 /100 | #89 | Exceptional 65.3% |
| Immigrants | Laos | 99.1 /100 | #90 | Exceptional 65.3% |
| Crow | 98.9 /100 | #91 | Exceptional 65.3% |
| Hopi | 98.8 /100 | #92 | Exceptional 65.3% |
| Guyanese | 98.8 /100 | #93 | Exceptional 65.3% |
| Immigrants | Poland | 98.7 /100 | #94 | Exceptional 65.2% |
Demographics Similar to Nicaraguans by Family Households
In terms of family households, the demographic groups most similar to Nicaraguans are Hawaiian (67.4%, a difference of 0.070%), Hispanic or Latino (67.4%, a difference of 0.080%), Immigrants from India (67.4%, a difference of 0.13%), Immigrants from Nicaragua (67.5%, a difference of 0.14%), and Immigrants from South Eastern Asia (67.5%, a difference of 0.16%).
| Demographics | Rating | Rank | Family Households |
| Sri Lankans | 100.0 /100 | #22 | Exceptional 67.7% |
| Immigrants | Pakistan | 100.0 /100 | #23 | Exceptional 67.7% |
| Immigrants | South Eastern Asia | 100.0 /100 | #24 | Exceptional 67.5% |
| Immigrants | Nicaragua | 100.0 /100 | #25 | Exceptional 67.5% |
| Immigrants | India | 100.0 /100 | #26 | Exceptional 67.4% |
| Hispanics or Latinos | 100.0 /100 | #27 | Exceptional 67.4% |
| Hawaiians | 100.0 /100 | #28 | Exceptional 67.4% |
| Nicaraguans | 100.0 /100 | #29 | Exceptional 67.4% |
| Immigrants | Peru | 100.0 /100 | #30 | Exceptional 67.2% |
| Immigrants | Latin America | 100.0 /100 | #31 | Exceptional 67.2% |
| Nepalese | 100.0 /100 | #32 | Exceptional 67.2% |
| Salvadorans | 100.0 /100 | #33 | Exceptional 67.2% |
| Thais | 100.0 /100 | #34 | Exceptional 67.2% |
| Tohono O'odham | 100.0 /100 | #35 | Exceptional 67.1% |
| Peruvians | 100.0 /100 | #36 | Exceptional 67.1% |