Immigrants from El Salvador vs Immigrants from Nigeria Births to Unmarried Women
COMPARE
Immigrants from El Salvador
Immigrants from Nigeria
Births to Unmarried Women
Births to Unmarried Women Comparison
Immigrants from El Salvador
Immigrants from Nigeria
36.4%
BIRTHS TO UNMARRIED WOMEN
0.2/ 100
METRIC RATING
259th/ 347
METRIC RANK
35.4%
BIRTHS TO UNMARRIED WOMEN
0.7/ 100
METRIC RATING
247th/ 347
METRIC RANK
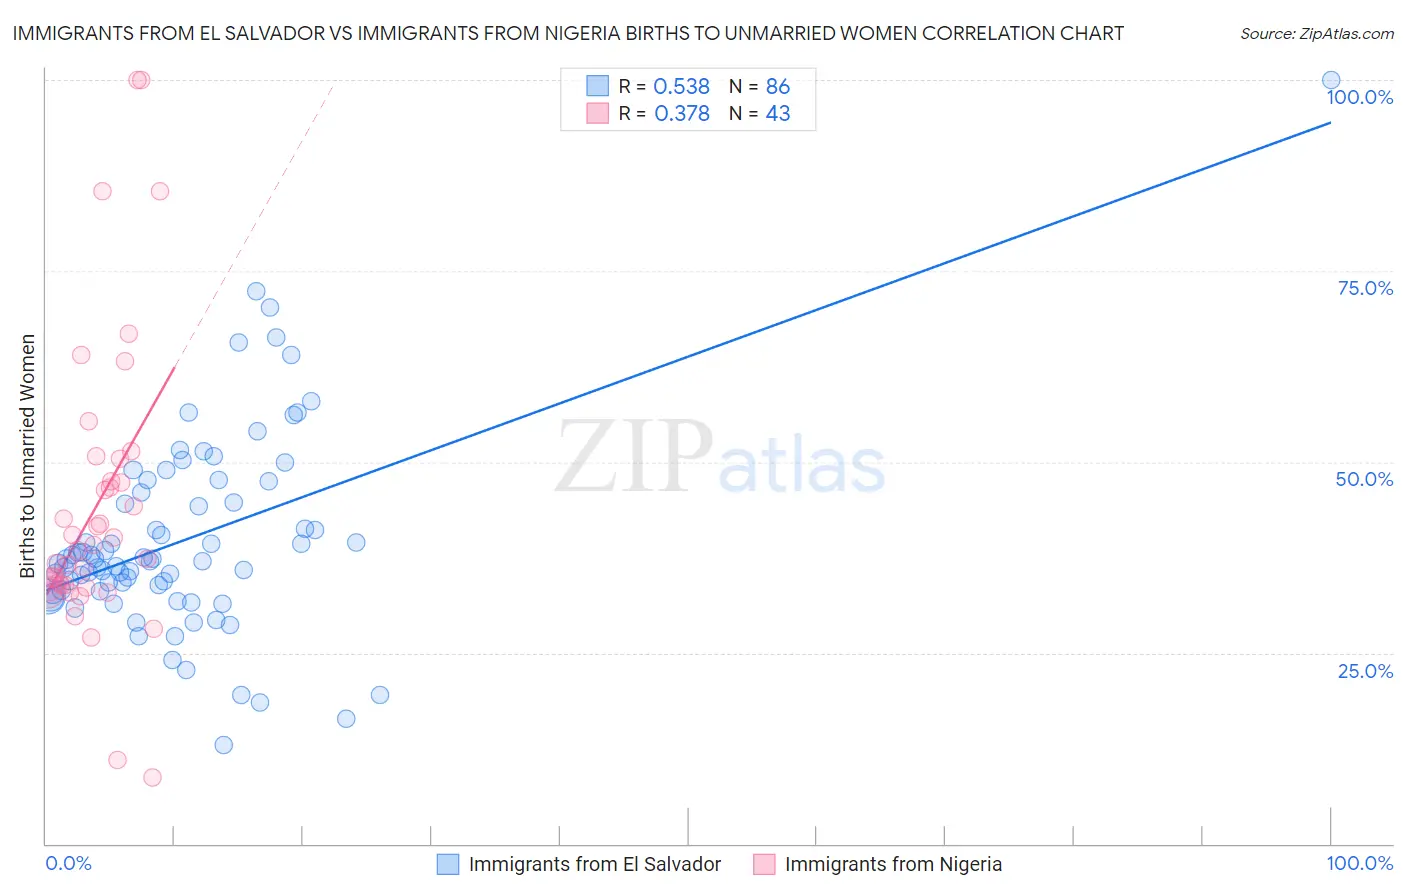
Immigrants from El Salvador vs Immigrants from Nigeria Births to Unmarried Women Correlation Chart
The statistical analysis conducted on geographies consisting of 341,352,792 people shows a substantial positive correlation between the proportion of Immigrants from El Salvador and percentage of births to unmarried women in the United States with a correlation coefficient (R) of 0.538 and weighted average of 36.4%. Similarly, the statistical analysis conducted on geographies consisting of 272,772,821 people shows a mild positive correlation between the proportion of Immigrants from Nigeria and percentage of births to unmarried women in the United States with a correlation coefficient (R) of 0.378 and weighted average of 35.4%, a difference of 2.9%.
Births to Unmarried Women Correlation Summary
| Measurement | Immigrants from El Salvador | Immigrants from Nigeria |
| Minimum | 12.9% | 8.7% |
| Maximum | 100.0% | 100.0% |
| Range | 87.1% | 91.3% |
| Mean | 39.8% | 44.4% |
| Median | 37.1% | 39.0% |
| Interquartile 25% (IQ1) | 33.0% | 33.6% |
| Interquartile 75% (IQ3) | 45.9% | 50.4% |
| Interquartile Range (IQR) | 12.9% | 16.8% |
| Standard Deviation (Sample) | 13.2% | 19.4% |
| Standard Deviation (Population) | 13.2% | 19.2% |
Demographics Similar to Immigrants from El Salvador and Immigrants from Nigeria by Births to Unmarried Women
In terms of births to unmarried women, the demographic groups most similar to Immigrants from El Salvador are American (36.4%, a difference of 0.050%), Ottawa (36.5%, a difference of 0.12%), Trinidadian and Tobagonian (36.5%, a difference of 0.12%), Immigrants from Grenada (36.3%, a difference of 0.33%), and Chickasaw (36.3%, a difference of 0.36%). Similarly, the demographic groups most similar to Immigrants from Nigeria are Nigerian (35.3%, a difference of 0.21%), Shoshone (35.3%, a difference of 0.32%), Nonimmigrants (35.5%, a difference of 0.33%), Bermudan (35.5%, a difference of 0.34%), and Guyanese (35.2%, a difference of 0.66%).
| Demographics | Rating | Rank | Births to Unmarried Women |
| Japanese | 0.9 /100 | #243 | Tragic 35.2% |
| Guyanese | 0.9 /100 | #244 | Tragic 35.2% |
| Shoshone | 0.8 /100 | #245 | Tragic 35.3% |
| Nigerians | 0.7 /100 | #246 | Tragic 35.3% |
| Immigrants | Nigeria | 0.7 /100 | #247 | Tragic 35.4% |
| Immigrants | Nonimmigrants | 0.6 /100 | #248 | Tragic 35.5% |
| Bermudans | 0.6 /100 | #249 | Tragic 35.5% |
| Mexican American Indians | 0.4 /100 | #250 | Tragic 35.7% |
| Immigrants | Western Africa | 0.3 /100 | #251 | Tragic 36.0% |
| Salvadorans | 0.3 /100 | #252 | Tragic 36.0% |
| Immigrants | Portugal | 0.2 /100 | #253 | Tragic 36.2% |
| Potawatomi | 0.2 /100 | #254 | Tragic 36.2% |
| Chickasaw | 0.2 /100 | #255 | Tragic 36.3% |
| Immigrants | Trinidad and Tobago | 0.2 /100 | #256 | Tragic 36.3% |
| Immigrants | Grenada | 0.2 /100 | #257 | Tragic 36.3% |
| Americans | 0.2 /100 | #258 | Tragic 36.4% |
| Immigrants | El Salvador | 0.2 /100 | #259 | Tragic 36.4% |
| Ottawa | 0.2 /100 | #260 | Tragic 36.5% |
| Trinidadians and Tobagonians | 0.2 /100 | #261 | Tragic 36.5% |
| French American Indians | 0.1 /100 | #262 | Tragic 36.6% |
| Nicaraguans | 0.1 /100 | #263 | Tragic 36.6% |