Immigrants from Eritrea vs Venezuelan Single Mother Households
COMPARE
Immigrants from Eritrea
Venezuelan
Single Mother Households
Single Mother Households Comparison
Immigrants from Eritrea
Venezuelans
6.7%
SINGLE MOTHER HOUSEHOLDS
8.4/ 100
METRIC RATING
212th/ 347
METRIC RANK
6.6%
SINGLE MOTHER HOUSEHOLDS
12.9/ 100
METRIC RATING
201st/ 347
METRIC RANK
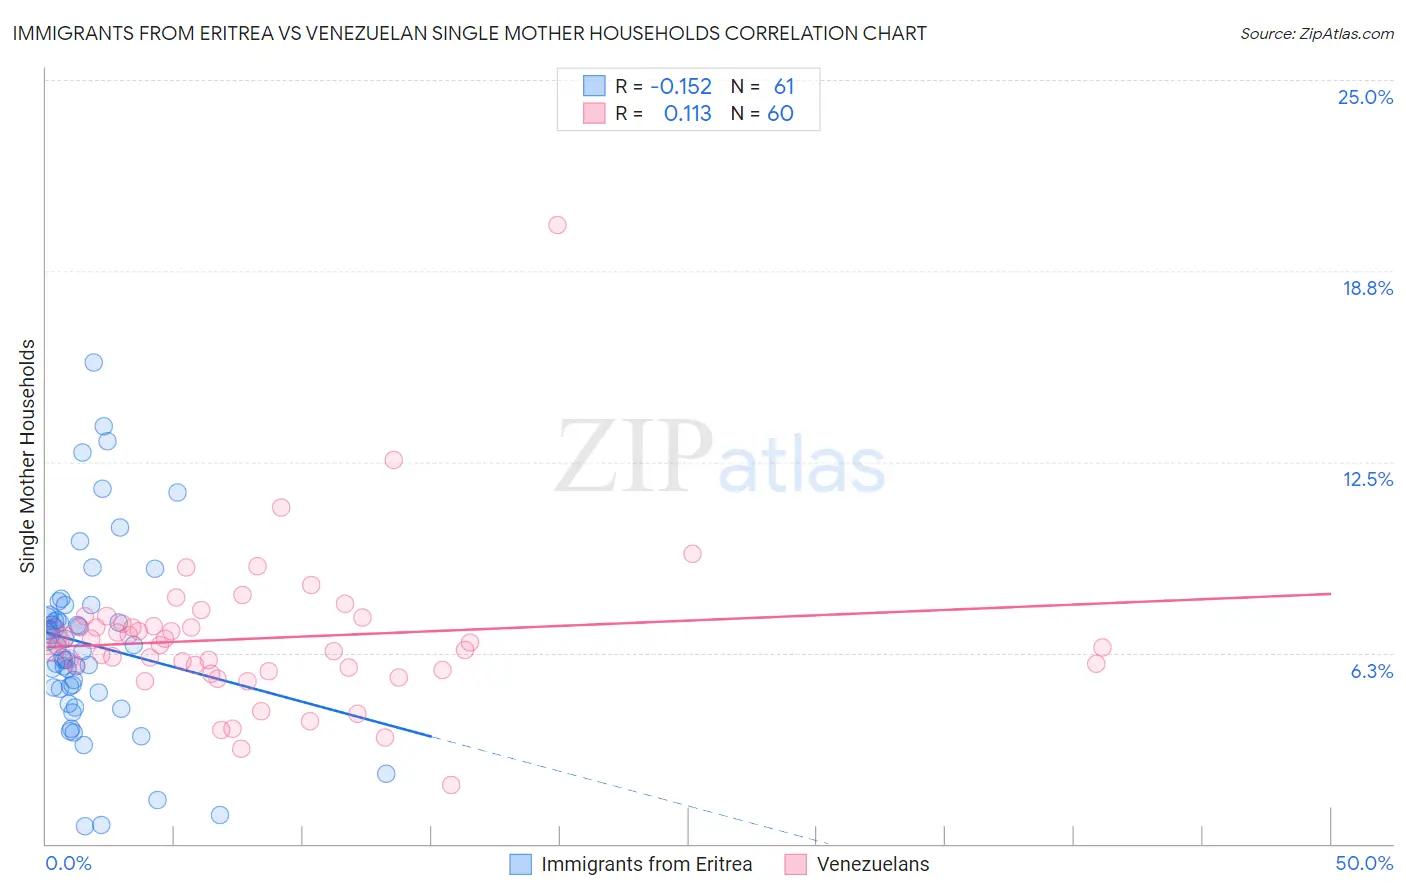
Immigrants from Eritrea vs Venezuelan Single Mother Households Correlation Chart
The statistical analysis conducted on geographies consisting of 104,781,978 people shows a poor negative correlation between the proportion of Immigrants from Eritrea and percentage of single mother households in the United States with a correlation coefficient (R) of -0.152 and weighted average of 6.7%. Similarly, the statistical analysis conducted on geographies consisting of 305,713,790 people shows a poor positive correlation between the proportion of Venezuelans and percentage of single mother households in the United States with a correlation coefficient (R) of 0.113 and weighted average of 6.6%, a difference of 1.3%.
Single Mother Households Correlation Summary
| Measurement | Immigrants from Eritrea | Venezuelan |
| Minimum | 0.57% | 1.9% |
| Maximum | 15.7% | 20.3% |
| Range | 15.2% | 18.4% |
| Mean | 6.5% | 6.7% |
| Median | 6.5% | 6.6% |
| Interquartile 25% (IQ1) | 5.0% | 5.7% |
| Interquartile 75% (IQ3) | 7.4% | 7.2% |
| Interquartile Range (IQR) | 2.4% | 1.4% |
| Standard Deviation (Sample) | 3.0% | 2.5% |
| Standard Deviation (Population) | 3.0% | 2.5% |
Demographics Similar to Immigrants from Eritrea and Venezuelans by Single Mother Households
In terms of single mother households, the demographic groups most similar to Immigrants from Eritrea are Immigrants from Venezuela (6.7%, a difference of 0.050%), Immigrants from Costa Rica (6.7%, a difference of 0.050%), Immigrants from Uruguay (6.7%, a difference of 0.16%), Nonimmigrants (6.7%, a difference of 0.63%), and Immigrants from Colombia (6.7%, a difference of 0.65%). Similarly, the demographic groups most similar to Venezuelans are Guamanian/Chamorro (6.6%, a difference of 0.12%), Immigrants from Peru (6.7%, a difference of 0.21%), Immigrants from Fiji (6.7%, a difference of 0.22%), Cree (6.7%, a difference of 0.24%), and German Russian (6.7%, a difference of 0.32%).
| Demographics | Rating | Rank | Single Mother Households |
| Uruguayans | 18.0 /100 | #196 | Poor 6.6% |
| Moroccans | 17.4 /100 | #197 | Poor 6.6% |
| Hawaiians | 16.1 /100 | #198 | Poor 6.6% |
| Potawatomi | 15.5 /100 | #199 | Poor 6.6% |
| Immigrants | Ethiopia | 14.7 /100 | #200 | Poor 6.6% |
| Venezuelans | 12.9 /100 | #201 | Poor 6.6% |
| Guamanians/Chamorros | 12.4 /100 | #202 | Poor 6.6% |
| Immigrants | Peru | 12.0 /100 | #203 | Poor 6.7% |
| Immigrants | Fiji | 11.9 /100 | #204 | Poor 6.7% |
| Cree | 11.9 /100 | #205 | Poor 6.7% |
| German Russians | 11.5 /100 | #206 | Poor 6.7% |
| Immigrants | South America | 11.5 /100 | #207 | Poor 6.7% |
| Vietnamese | 11.3 /100 | #208 | Poor 6.7% |
| Immigrants | Colombia | 10.5 /100 | #209 | Poor 6.7% |
| Immigrants | Nonimmigrants | 10.4 /100 | #210 | Poor 6.7% |
| Immigrants | Venezuela | 8.5 /100 | #211 | Tragic 6.7% |
| Immigrants | Eritrea | 8.4 /100 | #212 | Tragic 6.7% |
| Immigrants | Costa Rica | 8.2 /100 | #213 | Tragic 6.7% |
| Immigrants | Uruguay | 7.9 /100 | #214 | Tragic 6.7% |
| Shoshone | 5.7 /100 | #215 | Tragic 6.8% |
| Cherokee | 5.1 /100 | #216 | Tragic 6.8% |