Immigrants from Honduras vs Tlingit-Haida Married-couple Households
COMPARE
Immigrants from Honduras
Tlingit-Haida
Married-couple Households
Married-couple Households Comparison
Immigrants from Honduras
Tlingit-Haida
41.6%
MARRIED-COUPLE HOUSEHOLDS
0.0/ 100
METRIC RATING
302nd/ 347
METRIC RANK
45.1%
MARRIED-COUPLE HOUSEHOLDS
4.9/ 100
METRIC RATING
221st/ 347
METRIC RANK
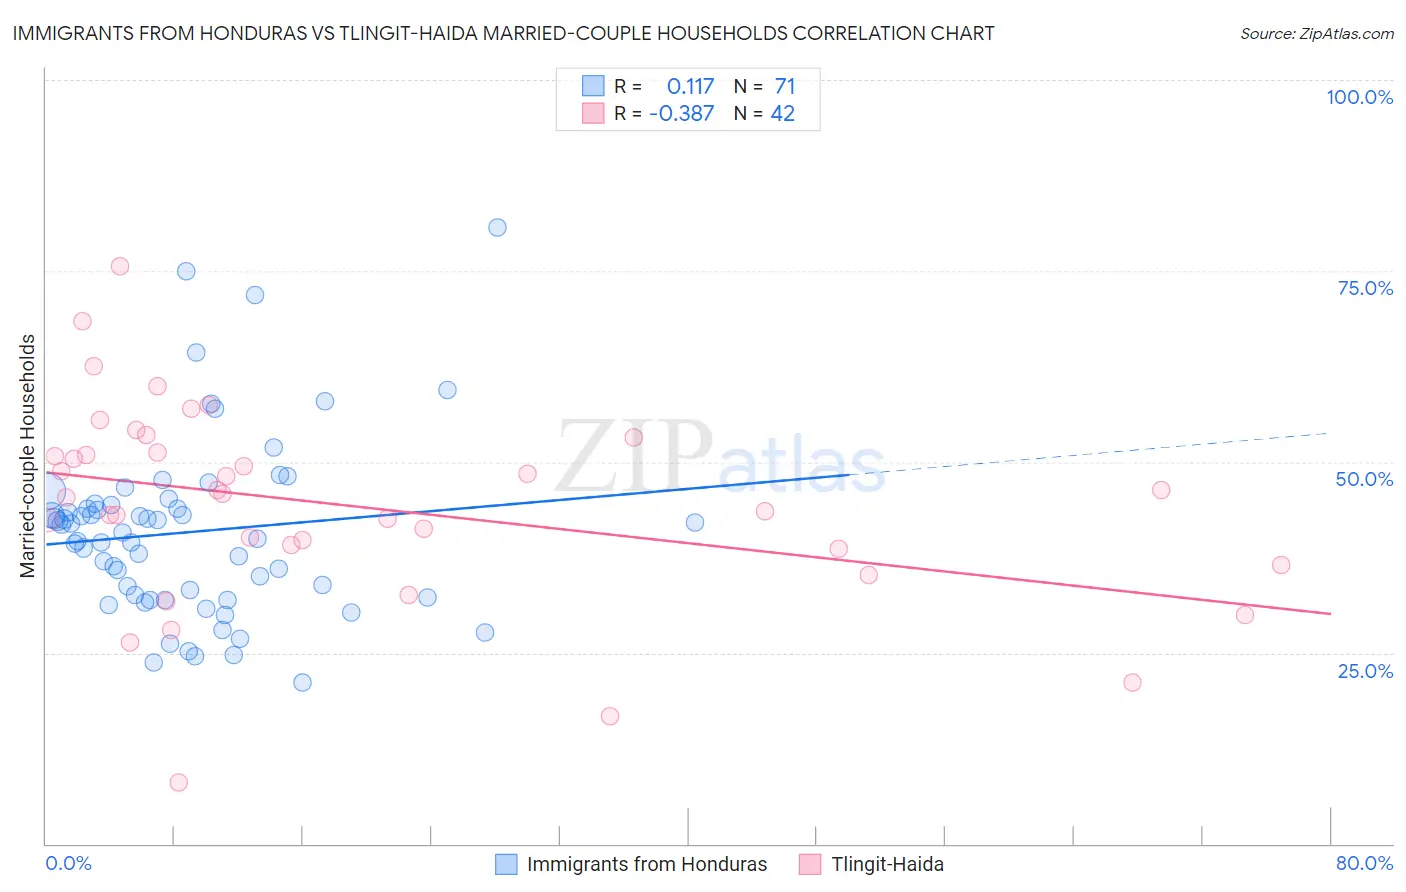
Immigrants from Honduras vs Tlingit-Haida Married-couple Households Correlation Chart
The statistical analysis conducted on geographies consisting of 322,465,433 people shows a poor positive correlation between the proportion of Immigrants from Honduras and percentage of married-couple family households in the United States with a correlation coefficient (R) of 0.117 and weighted average of 41.6%. Similarly, the statistical analysis conducted on geographies consisting of 60,855,605 people shows a mild negative correlation between the proportion of Tlingit-Haida and percentage of married-couple family households in the United States with a correlation coefficient (R) of -0.387 and weighted average of 45.1%, a difference of 8.5%.
Married-couple Households Correlation Summary
| Measurement | Immigrants from Honduras | Tlingit-Haida |
| Minimum | 21.2% | 8.0% |
| Maximum | 80.6% | 75.5% |
| Range | 59.5% | 67.5% |
| Mean | 40.8% | 44.2% |
| Median | 40.7% | 45.5% |
| Interquartile 25% (IQ1) | 32.3% | 38.7% |
| Interquartile 75% (IQ3) | 44.4% | 51.2% |
| Interquartile Range (IQR) | 12.1% | 12.6% |
| Standard Deviation (Sample) | 11.5% | 13.1% |
| Standard Deviation (Population) | 11.5% | 13.0% |
Similar Demographics by Married-couple Households
Demographics Similar to Immigrants from Honduras by Married-couple Households
In terms of married-couple households, the demographic groups most similar to Immigrants from Honduras are Subsaharan African (41.6%, a difference of 0.0%), Immigrants from Guyana (41.6%, a difference of 0.12%), Immigrants from Bahamas (41.7%, a difference of 0.17%), Sioux (41.5%, a difference of 0.23%), and Immigrants from Belize (41.8%, a difference of 0.38%).
| Demographics | Rating | Rank | Married-couple Households |
| Kiowa | 0.0 /100 | #295 | Tragic 42.0% |
| Immigrants | Sudan | 0.0 /100 | #296 | Tragic 41.9% |
| Arapaho | 0.0 /100 | #297 | Tragic 41.8% |
| Immigrants | Middle Africa | 0.0 /100 | #298 | Tragic 41.8% |
| Immigrants | Ghana | 0.0 /100 | #299 | Tragic 41.8% |
| Immigrants | Belize | 0.0 /100 | #300 | Tragic 41.8% |
| Immigrants | Bahamas | 0.0 /100 | #301 | Tragic 41.7% |
| Immigrants | Honduras | 0.0 /100 | #302 | Tragic 41.6% |
| Sub-Saharan Africans | 0.0 /100 | #303 | Tragic 41.6% |
| Immigrants | Guyana | 0.0 /100 | #304 | Tragic 41.6% |
| Sioux | 0.0 /100 | #305 | Tragic 41.5% |
| Guyanese | 0.0 /100 | #306 | Tragic 41.4% |
| Immigrants | Western Africa | 0.0 /100 | #307 | Tragic 41.4% |
| Crow | 0.0 /100 | #308 | Tragic 41.4% |
| Immigrants | Trinidad and Tobago | 0.0 /100 | #309 | Tragic 41.2% |
Demographics Similar to Tlingit-Haida by Married-couple Households
In terms of married-couple households, the demographic groups most similar to Tlingit-Haida are Immigrants from Thailand (45.2%, a difference of 0.050%), Immigrants from Laos (45.1%, a difference of 0.050%), Nicaraguan (45.2%, a difference of 0.080%), Immigrants from the Azores (45.2%, a difference of 0.090%), and Panamanian (45.2%, a difference of 0.11%).
| Demographics | Rating | Rank | Married-couple Households |
| Japanese | 5.7 /100 | #214 | Tragic 45.2% |
| Immigrants | Nepal | 5.6 /100 | #215 | Tragic 45.2% |
| Immigrants | Portugal | 5.6 /100 | #216 | Tragic 45.2% |
| Panamanians | 5.5 /100 | #217 | Tragic 45.2% |
| Immigrants | Azores | 5.3 /100 | #218 | Tragic 45.2% |
| Nicaraguans | 5.3 /100 | #219 | Tragic 45.2% |
| Immigrants | Thailand | 5.1 /100 | #220 | Tragic 45.2% |
| Tlingit-Haida | 4.9 /100 | #221 | Tragic 45.1% |
| Immigrants | Laos | 4.6 /100 | #222 | Tragic 45.1% |
| Immigrants | Cambodia | 2.7 /100 | #223 | Tragic 44.9% |
| Immigrants | Micronesia | 2.6 /100 | #224 | Tragic 44.9% |
| Dutch West Indians | 2.6 /100 | #225 | Tragic 44.9% |
| Alsatians | 2.3 /100 | #226 | Tragic 44.8% |
| Salvadorans | 1.9 /100 | #227 | Tragic 44.7% |
| Kenyans | 1.7 /100 | #228 | Tragic 44.7% |