Immigrants from Jamaica vs Immigrants from Latin America Family Households with Children
COMPARE
Immigrants from Jamaica
Immigrants from Latin America
Family Households with Children
Family Households with Children Comparison
Immigrants from Jamaica
Immigrants from Latin America
26.8%
FAMILY HOUSEHOLDS WITH CHILDREN
1.2/ 100
METRIC RATING
260th/ 347
METRIC RANK
29.7%
FAMILY HOUSEHOLDS WITH CHILDREN
100.0/ 100
METRIC RATING
25th/ 347
METRIC RANK
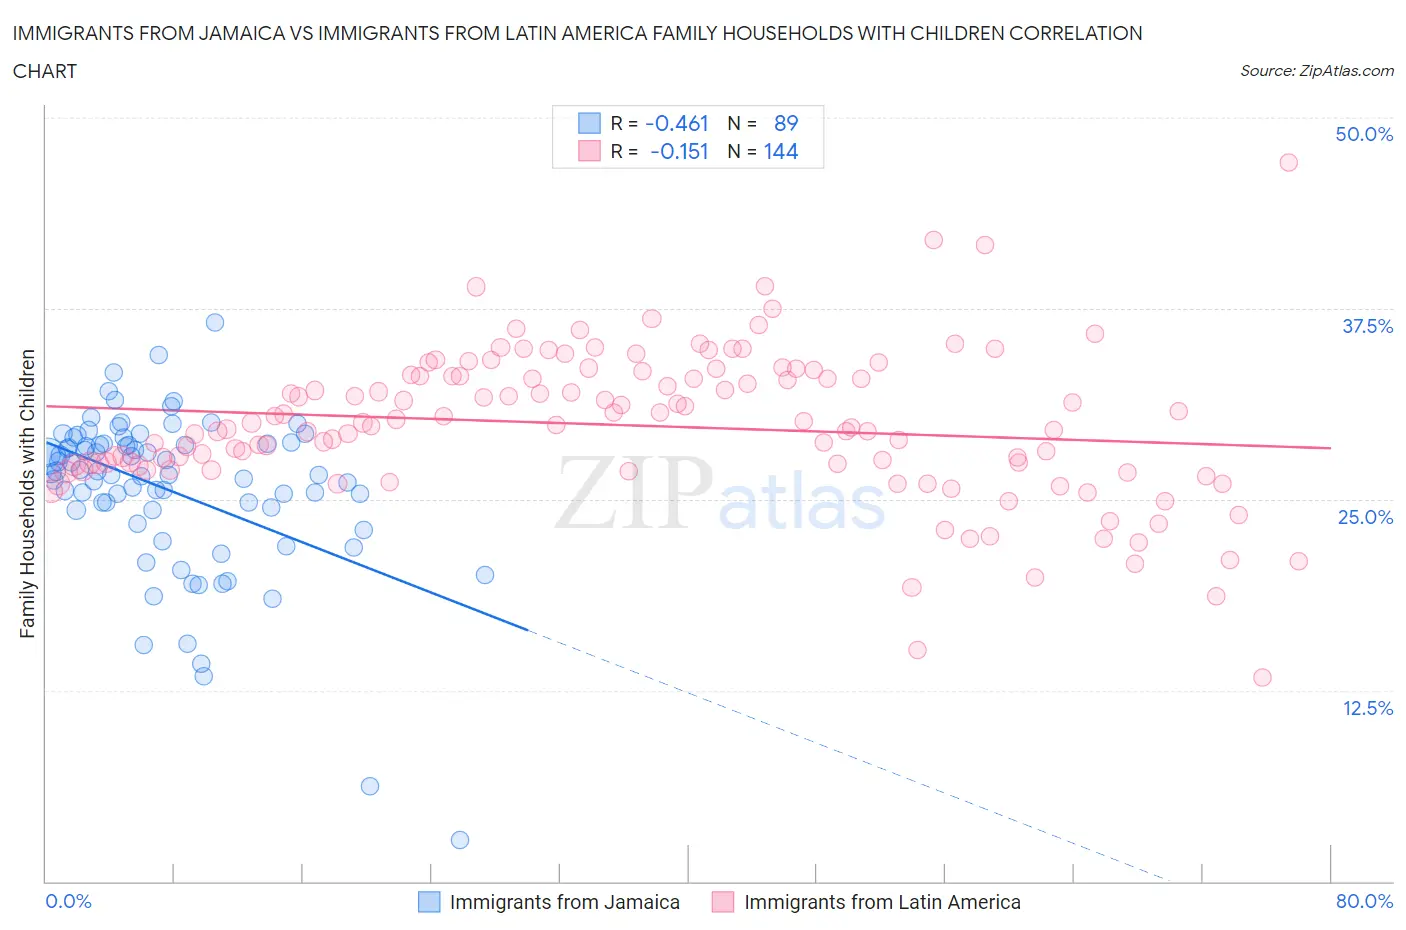
Immigrants from Jamaica vs Immigrants from Latin America Family Households with Children Correlation Chart
The statistical analysis conducted on geographies consisting of 301,520,454 people shows a moderate negative correlation between the proportion of Immigrants from Jamaica and percentage of family households with children in the United States with a correlation coefficient (R) of -0.461 and weighted average of 26.8%. Similarly, the statistical analysis conducted on geographies consisting of 557,667,257 people shows a poor negative correlation between the proportion of Immigrants from Latin America and percentage of family households with children in the United States with a correlation coefficient (R) of -0.151 and weighted average of 29.7%, a difference of 10.8%.
Family Households with Children Correlation Summary
| Measurement | Immigrants from Jamaica | Immigrants from Latin America |
| Minimum | 2.7% | 13.3% |
| Maximum | 36.6% | 47.1% |
| Range | 33.9% | 33.7% |
| Mean | 25.6% | 29.8% |
| Median | 26.7% | 29.8% |
| Interquartile 25% (IQ1) | 24.3% | 27.1% |
| Interquartile 75% (IQ3) | 28.6% | 33.1% |
| Interquartile Range (IQR) | 4.3% | 6.0% |
| Standard Deviation (Sample) | 5.4% | 4.9% |
| Standard Deviation (Population) | 5.4% | 4.9% |
Similar Demographics by Family Households with Children
Demographics Similar to Immigrants from Jamaica by Family Households with Children
In terms of family households with children, the demographic groups most similar to Immigrants from Jamaica are Immigrants from Lithuania (26.8%, a difference of 0.020%), Slavic (26.8%, a difference of 0.050%), Immigrants from Cuba (26.8%, a difference of 0.050%), Immigrants from Belarus (26.8%, a difference of 0.060%), and Scotch-Irish (26.8%, a difference of 0.10%).
| Demographics | Rating | Rank | Family Households with Children |
| Italians | 1.5 /100 | #253 | Tragic 26.8% |
| Immigrants | Scotland | 1.5 /100 | #254 | Tragic 26.8% |
| German Russians | 1.5 /100 | #255 | Tragic 26.8% |
| Scotch-Irish | 1.4 /100 | #256 | Tragic 26.8% |
| Slavs | 1.3 /100 | #257 | Tragic 26.8% |
| Immigrants | Cuba | 1.3 /100 | #258 | Tragic 26.8% |
| Immigrants | Lithuania | 1.2 /100 | #259 | Tragic 26.8% |
| Immigrants | Jamaica | 1.2 /100 | #260 | Tragic 26.8% |
| Immigrants | Belarus | 1.1 /100 | #261 | Tragic 26.8% |
| Immigrants | Russia | 1.0 /100 | #262 | Tragic 26.8% |
| Immigrants | North Macedonia | 1.0 /100 | #263 | Tragic 26.7% |
| Taiwanese | 0.9 /100 | #264 | Tragic 26.7% |
| Chippewa | 0.9 /100 | #265 | Tragic 26.7% |
| Maltese | 0.9 /100 | #266 | Tragic 26.7% |
| Immigrants | Uzbekistan | 0.9 /100 | #267 | Tragic 26.7% |
Demographics Similar to Immigrants from Latin America by Family Households with Children
In terms of family households with children, the demographic groups most similar to Immigrants from Latin America are Guamanian/Chamorro (29.7%, a difference of 0.10%), Mexican American Indian (29.7%, a difference of 0.20%), Sri Lankan (29.5%, a difference of 0.44%), Malaysian (29.8%, a difference of 0.47%), and Immigrants from Vietnam (29.5%, a difference of 0.47%).
| Demographics | Rating | Rank | Family Households with Children |
| Salvadorans | 100.0 /100 | #18 | Exceptional 29.9% |
| Alaska Natives | 100.0 /100 | #19 | Exceptional 29.9% |
| Immigrants | El Salvador | 100.0 /100 | #20 | Exceptional 29.8% |
| Immigrants | Laos | 100.0 /100 | #21 | Exceptional 29.8% |
| Malaysians | 100.0 /100 | #22 | Exceptional 29.8% |
| Mexican American Indians | 100.0 /100 | #23 | Exceptional 29.7% |
| Guamanians/Chamorros | 100.0 /100 | #24 | Exceptional 29.7% |
| Immigrants | Latin America | 100.0 /100 | #25 | Exceptional 29.7% |
| Sri Lankans | 100.0 /100 | #26 | Exceptional 29.5% |
| Immigrants | Vietnam | 100.0 /100 | #27 | Exceptional 29.5% |
| Samoans | 100.0 /100 | #28 | Exceptional 29.5% |
| Bolivians | 100.0 /100 | #29 | Exceptional 29.5% |
| Yuman | 100.0 /100 | #30 | Exceptional 29.5% |
| Japanese | 100.0 /100 | #31 | Exceptional 29.4% |
| Immigrants | Yemen | 100.0 /100 | #32 | Exceptional 29.4% |