Immigrants from Japan vs Immigrants from Greece Births to Unmarried Women
COMPARE
Immigrants from Japan
Immigrants from Greece
Births to Unmarried Women
Births to Unmarried Women Comparison
Immigrants from Japan
Immigrants from Greece
26.4%
BIRTHS TO UNMARRIED WOMEN
99.9/ 100
METRIC RATING
23rd/ 347
METRIC RANK
27.8%
BIRTHS TO UNMARRIED WOMEN
99.4/ 100
METRIC RATING
49th/ 347
METRIC RANK
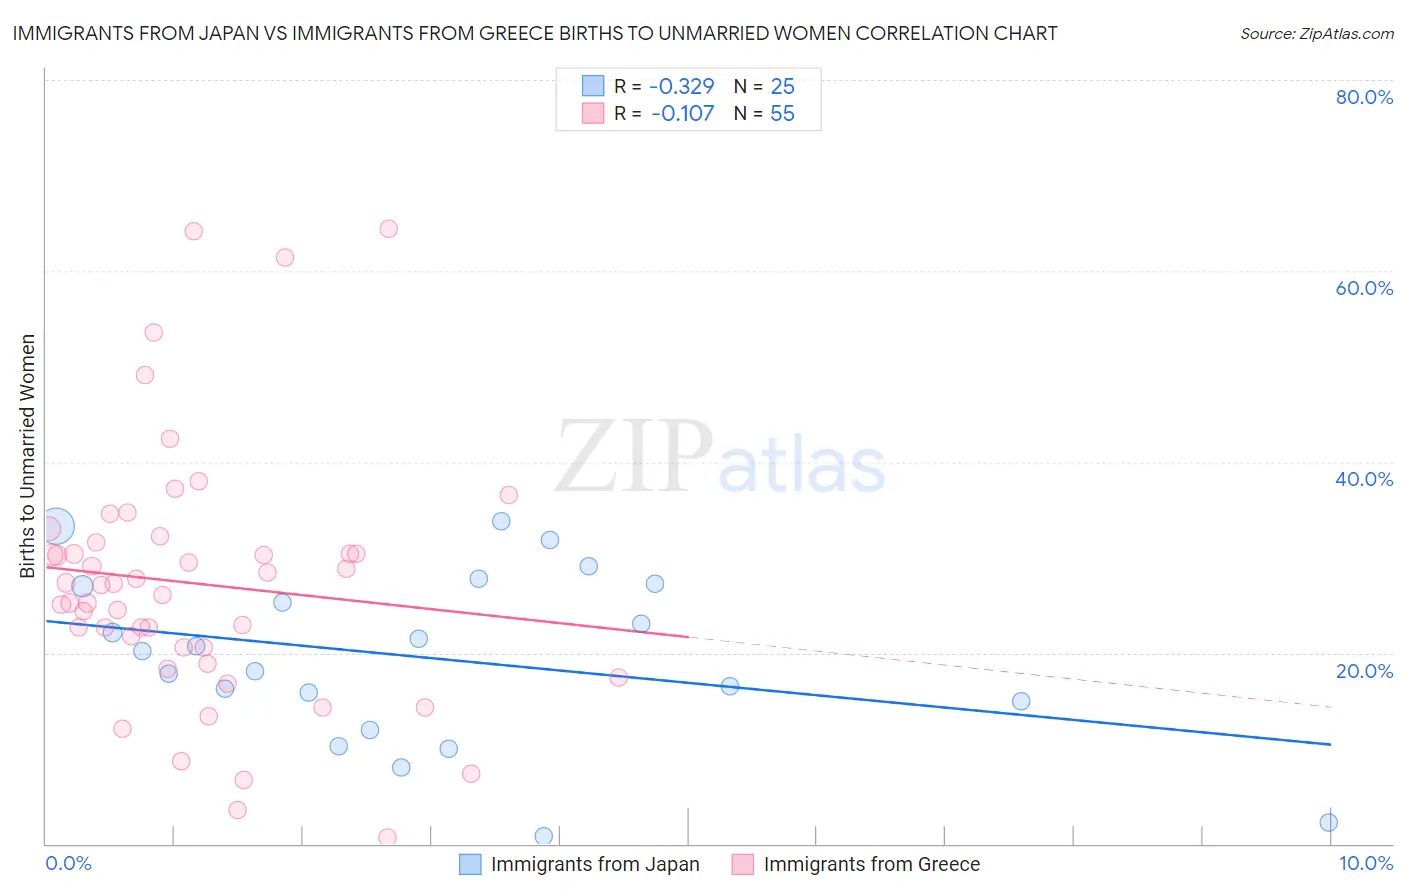
Immigrants from Japan vs Immigrants from Greece Births to Unmarried Women Correlation Chart
The statistical analysis conducted on geographies consisting of 319,959,110 people shows a mild negative correlation between the proportion of Immigrants from Japan and percentage of births to unmarried women in the United States with a correlation coefficient (R) of -0.329 and weighted average of 26.4%. Similarly, the statistical analysis conducted on geographies consisting of 203,732,129 people shows a poor negative correlation between the proportion of Immigrants from Greece and percentage of births to unmarried women in the United States with a correlation coefficient (R) of -0.107 and weighted average of 27.8%, a difference of 5.2%.
Births to Unmarried Women Correlation Summary
| Measurement | Immigrants from Japan | Immigrants from Greece |
| Minimum | 0.80% | 0.70% |
| Maximum | 33.8% | 64.4% |
| Range | 33.0% | 63.7% |
| Mean | 19.4% | 27.2% |
| Median | 20.2% | 27.1% |
| Interquartile 25% (IQ1) | 13.4% | 20.5% |
| Interquartile 75% (IQ3) | 27.1% | 31.6% |
| Interquartile Range (IQR) | 13.7% | 11.1% |
| Standard Deviation (Sample) | 9.0% | 13.4% |
| Standard Deviation (Population) | 8.8% | 13.3% |
Similar Demographics by Births to Unmarried Women
Demographics Similar to Immigrants from Japan by Births to Unmarried Women
In terms of births to unmarried women, the demographic groups most similar to Immigrants from Japan are Burmese (26.4%, a difference of 0.19%), Soviet Union (26.3%, a difference of 0.41%), Immigrants from Korea (26.3%, a difference of 0.55%), Armenian (26.2%, a difference of 0.76%), and Immigrants from Australia (26.6%, a difference of 0.79%).
| Demographics | Rating | Rank | Births to Unmarried Women |
| Immigrants | Belarus | 100.0 /100 | #16 | Exceptional 25.6% |
| Immigrants | Uzbekistan | 100.0 /100 | #17 | Exceptional 25.8% |
| Immigrants | Armenia | 99.9 /100 | #18 | Exceptional 26.1% |
| Armenians | 99.9 /100 | #19 | Exceptional 26.2% |
| Immigrants | Korea | 99.9 /100 | #20 | Exceptional 26.3% |
| Soviet Union | 99.9 /100 | #21 | Exceptional 26.3% |
| Burmese | 99.9 /100 | #22 | Exceptional 26.4% |
| Immigrants | Japan | 99.9 /100 | #23 | Exceptional 26.4% |
| Immigrants | Australia | 99.9 /100 | #24 | Exceptional 26.6% |
| Cambodians | 99.9 /100 | #25 | Exceptional 26.7% |
| Asians | 99.9 /100 | #26 | Exceptional 26.8% |
| Immigrants | Asia | 99.9 /100 | #27 | Exceptional 26.8% |
| Okinawans | 99.8 /100 | #28 | Exceptional 26.9% |
| Cypriots | 99.8 /100 | #29 | Exceptional 27.0% |
| Bulgarians | 99.8 /100 | #30 | Exceptional 27.1% |
Demographics Similar to Immigrants from Greece by Births to Unmarried Women
In terms of births to unmarried women, the demographic groups most similar to Immigrants from Greece are Maltese (27.8%, a difference of 0.12%), Eastern European (27.7%, a difference of 0.19%), Immigrants from Lithuania (27.7%, a difference of 0.20%), Hmong (27.7%, a difference of 0.20%), and Latvian (27.7%, a difference of 0.24%).
| Demographics | Rating | Rank | Births to Unmarried Women |
| Immigrants | Eastern Europe | 99.6 /100 | #42 | Exceptional 27.6% |
| Immigrants | Bulgaria | 99.6 /100 | #43 | Exceptional 27.6% |
| Immigrants | Indonesia | 99.5 /100 | #44 | Exceptional 27.7% |
| Latvians | 99.5 /100 | #45 | Exceptional 27.7% |
| Immigrants | Lithuania | 99.5 /100 | #46 | Exceptional 27.7% |
| Hmong | 99.5 /100 | #47 | Exceptional 27.7% |
| Eastern Europeans | 99.5 /100 | #48 | Exceptional 27.7% |
| Immigrants | Greece | 99.4 /100 | #49 | Exceptional 27.8% |
| Maltese | 99.4 /100 | #50 | Exceptional 27.8% |
| Macedonians | 99.4 /100 | #51 | Exceptional 27.9% |
| Bhutanese | 99.4 /100 | #52 | Exceptional 27.9% |
| Immigrants | Romania | 99.4 /100 | #53 | Exceptional 27.9% |
| Afghans | 99.4 /100 | #54 | Exceptional 27.9% |
| Mongolians | 99.3 /100 | #55 | Exceptional 27.9% |
| Immigrants | Belgium | 99.3 /100 | #56 | Exceptional 28.0% |