Immigrants from Kazakhstan vs Latvian Married-couple Households
COMPARE
Immigrants from Kazakhstan
Latvian
Married-couple Households
Married-couple Households Comparison
Immigrants from Kazakhstan
Latvians
46.8%
MARRIED-COUPLE HOUSEHOLDS
70.0/ 100
METRIC RATING
164th/ 347
METRIC RANK
47.9%
MARRIED-COUPLE HOUSEHOLDS
96.5/ 100
METRIC RATING
97th/ 347
METRIC RANK
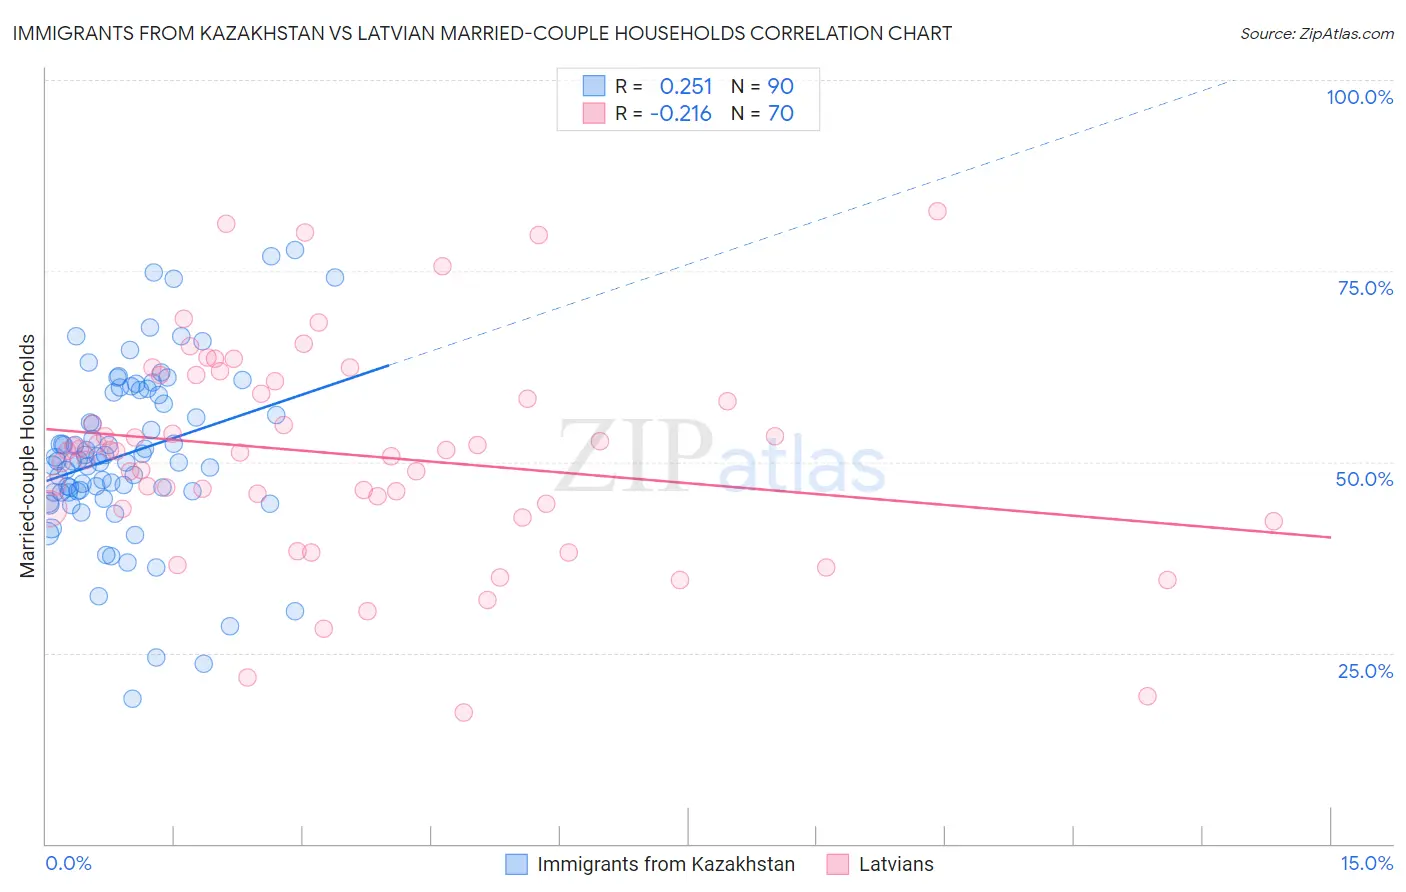
Immigrants from Kazakhstan vs Latvian Married-couple Households Correlation Chart
The statistical analysis conducted on geographies consisting of 124,426,668 people shows a weak positive correlation between the proportion of Immigrants from Kazakhstan and percentage of married-couple family households in the United States with a correlation coefficient (R) of 0.251 and weighted average of 46.8%. Similarly, the statistical analysis conducted on geographies consisting of 220,654,230 people shows a weak negative correlation between the proportion of Latvians and percentage of married-couple family households in the United States with a correlation coefficient (R) of -0.216 and weighted average of 47.9%, a difference of 2.3%.
Married-couple Households Correlation Summary
| Measurement | Immigrants from Kazakhstan | Latvian |
| Minimum | 19.0% | 17.2% |
| Maximum | 77.7% | 82.8% |
| Range | 58.8% | 65.5% |
| Mean | 51.1% | 51.0% |
| Median | 50.2% | 51.4% |
| Interquartile 25% (IQ1) | 46.0% | 43.9% |
| Interquartile 75% (IQ3) | 59.1% | 60.6% |
| Interquartile Range (IQR) | 13.0% | 16.7% |
| Standard Deviation (Sample) | 11.1% | 13.8% |
| Standard Deviation (Population) | 11.1% | 13.7% |
Similar Demographics by Married-couple Households
Demographics Similar to Immigrants from Kazakhstan by Married-couple Households
In terms of married-couple households, the demographic groups most similar to Immigrants from Kazakhstan are Immigrants from Southern Europe (46.8%, a difference of 0.0%), Immigrants from Turkey (46.8%, a difference of 0.010%), Colombian (46.8%, a difference of 0.050%), Delaware (46.8%, a difference of 0.060%), and Iraqi (46.9%, a difference of 0.080%).
| Demographics | Rating | Rank | Married-couple Households |
| Immigrants | Oceania | 74.8 /100 | #157 | Good 46.9% |
| Immigrants | Nonimmigrants | 73.3 /100 | #158 | Good 46.9% |
| Osage | 73.2 /100 | #159 | Good 46.9% |
| Iraqis | 71.7 /100 | #160 | Good 46.9% |
| Delaware | 71.2 /100 | #161 | Good 46.8% |
| Colombians | 71.0 /100 | #162 | Good 46.8% |
| Immigrants | Turkey | 70.2 /100 | #163 | Good 46.8% |
| Immigrants | Kazakhstan | 70.0 /100 | #164 | Good 46.8% |
| Immigrants | Southern Europe | 69.9 /100 | #165 | Good 46.8% |
| Cherokee | 65.7 /100 | #166 | Good 46.7% |
| Immigrants | Croatia | 64.2 /100 | #167 | Good 46.7% |
| Israelis | 62.3 /100 | #168 | Good 46.7% |
| Spanish American Indians | 59.4 /100 | #169 | Average 46.6% |
| South Americans | 58.0 /100 | #170 | Average 46.6% |
| Immigrants | Chile | 55.7 /100 | #171 | Average 46.5% |
Demographics Similar to Latvians by Married-couple Households
In terms of married-couple households, the demographic groups most similar to Latvians are Immigrants from North Macedonia (47.9%, a difference of 0.010%), Immigrants from Austria (47.9%, a difference of 0.020%), Immigrants from Egypt (47.9%, a difference of 0.030%), Immigrants from Italy (47.9%, a difference of 0.030%), and Immigrants from Belgium (47.9%, a difference of 0.080%).
| Demographics | Rating | Rank | Married-couple Households |
| French | 97.2 /100 | #90 | Exceptional 48.0% |
| Immigrants | Moldova | 97.0 /100 | #91 | Exceptional 48.0% |
| Palestinians | 96.9 /100 | #92 | Exceptional 48.0% |
| Lebanese | 96.9 /100 | #93 | Exceptional 47.9% |
| Americans | 96.9 /100 | #94 | Exceptional 47.9% |
| Immigrants | Belgium | 96.8 /100 | #95 | Exceptional 47.9% |
| Immigrants | Egypt | 96.6 /100 | #96 | Exceptional 47.9% |
| Latvians | 96.5 /100 | #97 | Exceptional 47.9% |
| Immigrants | North Macedonia | 96.4 /100 | #98 | Exceptional 47.9% |
| Immigrants | Austria | 96.4 /100 | #99 | Exceptional 47.9% |
| Immigrants | Italy | 96.3 /100 | #100 | Exceptional 47.9% |
| Turks | 96.1 /100 | #101 | Exceptional 47.8% |
| Slavs | 96.0 /100 | #102 | Exceptional 47.8% |
| Hawaiians | 96.0 /100 | #103 | Exceptional 47.8% |
| Immigrants | South Africa | 96.0 /100 | #104 | Exceptional 47.8% |