Immigrants from Latin America vs British Births to Unmarried Women
COMPARE
Immigrants from Latin America
British
Births to Unmarried Women
Births to Unmarried Women Comparison
Immigrants from Latin America
British
37.1%
BIRTHS TO UNMARRIED WOMEN
0.1/ 100
METRIC RATING
278th/ 347
METRIC RANK
30.8%
BIRTHS TO UNMARRIED WOMEN
76.0/ 100
METRIC RATING
153rd/ 347
METRIC RANK
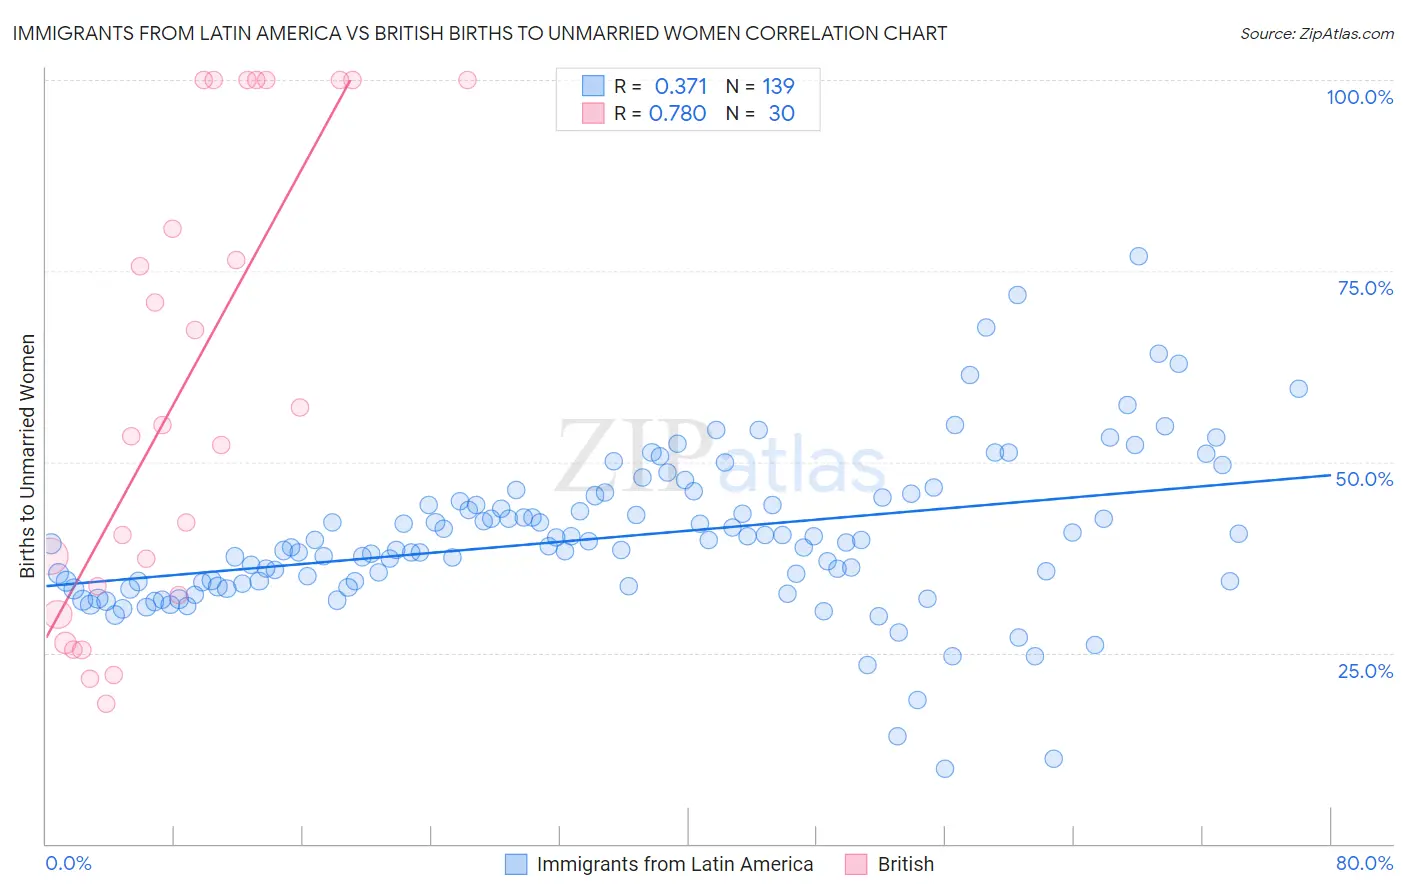
Immigrants from Latin America vs British Births to Unmarried Women Correlation Chart
The statistical analysis conducted on geographies consisting of 501,046,047 people shows a mild positive correlation between the proportion of Immigrants from Latin America and percentage of births to unmarried women in the United States with a correlation coefficient (R) of 0.371 and weighted average of 37.1%. Similarly, the statistical analysis conducted on geographies consisting of 478,658,023 people shows a strong positive correlation between the proportion of British and percentage of births to unmarried women in the United States with a correlation coefficient (R) of 0.780 and weighted average of 30.8%, a difference of 20.6%.
Births to Unmarried Women Correlation Summary
| Measurement | Immigrants from Latin America | British |
| Minimum | 9.8% | 18.3% |
| Maximum | 77.0% | 100.0% |
| Range | 67.2% | 81.7% |
| Mean | 40.1% | 59.4% |
| Median | 39.4% | 54.1% |
| Interquartile 25% (IQ1) | 34.1% | 32.5% |
| Interquartile 75% (IQ3) | 44.9% | 100.0% |
| Interquartile Range (IQR) | 10.7% | 67.5% |
| Standard Deviation (Sample) | 10.3% | 30.1% |
| Standard Deviation (Population) | 10.3% | 29.6% |
Similar Demographics by Births to Unmarried Women
Demographics Similar to Immigrants from Latin America by Births to Unmarried Women
In terms of births to unmarried women, the demographic groups most similar to Immigrants from Latin America are Guatemalan (37.1%, a difference of 0.090%), Belizean (37.0%, a difference of 0.30%), West Indian (37.3%, a difference of 0.33%), Immigrants from St. Vincent and the Grenadines (37.3%, a difference of 0.45%), and Immigrants from Belize (37.3%, a difference of 0.47%).
| Demographics | Rating | Rank | Births to Unmarried Women |
| Immigrants | Barbados | 0.1 /100 | #271 | Tragic 36.8% |
| Choctaw | 0.1 /100 | #272 | Tragic 36.9% |
| Mexicans | 0.1 /100 | #273 | Tragic 36.9% |
| Cree | 0.1 /100 | #274 | Tragic 37.0% |
| Barbadians | 0.1 /100 | #275 | Tragic 37.0% |
| Belizeans | 0.1 /100 | #276 | Tragic 37.0% |
| Guatemalans | 0.1 /100 | #277 | Tragic 37.1% |
| Immigrants | Latin America | 0.1 /100 | #278 | Tragic 37.1% |
| West Indians | 0.1 /100 | #279 | Tragic 37.3% |
| Immigrants | St. Vincent and the Grenadines | 0.1 /100 | #280 | Tragic 37.3% |
| Immigrants | Belize | 0.1 /100 | #281 | Tragic 37.3% |
| Liberians | 0.0 /100 | #282 | Tragic 37.4% |
| Spanish American Indians | 0.0 /100 | #283 | Tragic 37.4% |
| Immigrants | Central America | 0.0 /100 | #284 | Tragic 37.4% |
| Immigrants | Mexico | 0.0 /100 | #285 | Tragic 37.5% |
Demographics Similar to British by Births to Unmarried Women
In terms of births to unmarried women, the demographic groups most similar to British are Polish (30.8%, a difference of 0.020%), Yugoslavian (30.8%, a difference of 0.12%), Italian (30.8%, a difference of 0.13%), Somali (30.7%, a difference of 0.24%), and Immigrants from Bangladesh (30.9%, a difference of 0.27%).
| Demographics | Rating | Rank | Births to Unmarried Women |
| Northern Europeans | 81.4 /100 | #146 | Excellent 30.6% |
| Immigrants | Oceania | 81.2 /100 | #147 | Excellent 30.6% |
| Chileans | 79.1 /100 | #148 | Good 30.7% |
| Serbians | 78.8 /100 | #149 | Good 30.7% |
| Somalis | 77.8 /100 | #150 | Good 30.7% |
| Italians | 77.0 /100 | #151 | Good 30.8% |
| Poles | 76.2 /100 | #152 | Good 30.8% |
| British | 76.0 /100 | #153 | Good 30.8% |
| Yugoslavians | 75.1 /100 | #154 | Good 30.8% |
| Immigrants | Bangladesh | 73.9 /100 | #155 | Good 30.9% |
| Carpatho Rusyns | 73.5 /100 | #156 | Good 30.9% |
| Immigrants | Eastern Africa | 72.1 /100 | #157 | Good 31.0% |
| Austrians | 69.9 /100 | #158 | Good 31.0% |
| Immigrants | England | 69.4 /100 | #159 | Good 31.1% |
| Immigrants | Western Europe | 69.3 /100 | #160 | Good 31.1% |