Immigrants from Netherlands vs Cherokee Average Family Size
COMPARE
Immigrants from Netherlands
Cherokee
Average Family Size
Average Family Size Comparison
Immigrants from Netherlands
Cherokee
3.14
AVERAGE FAMILY SIZE
0.3/ 100
METRIC RATING
286th/ 347
METRIC RANK
3.18
AVERAGE FAMILY SIZE
4.7/ 100
METRIC RATING
232nd/ 347
METRIC RANK
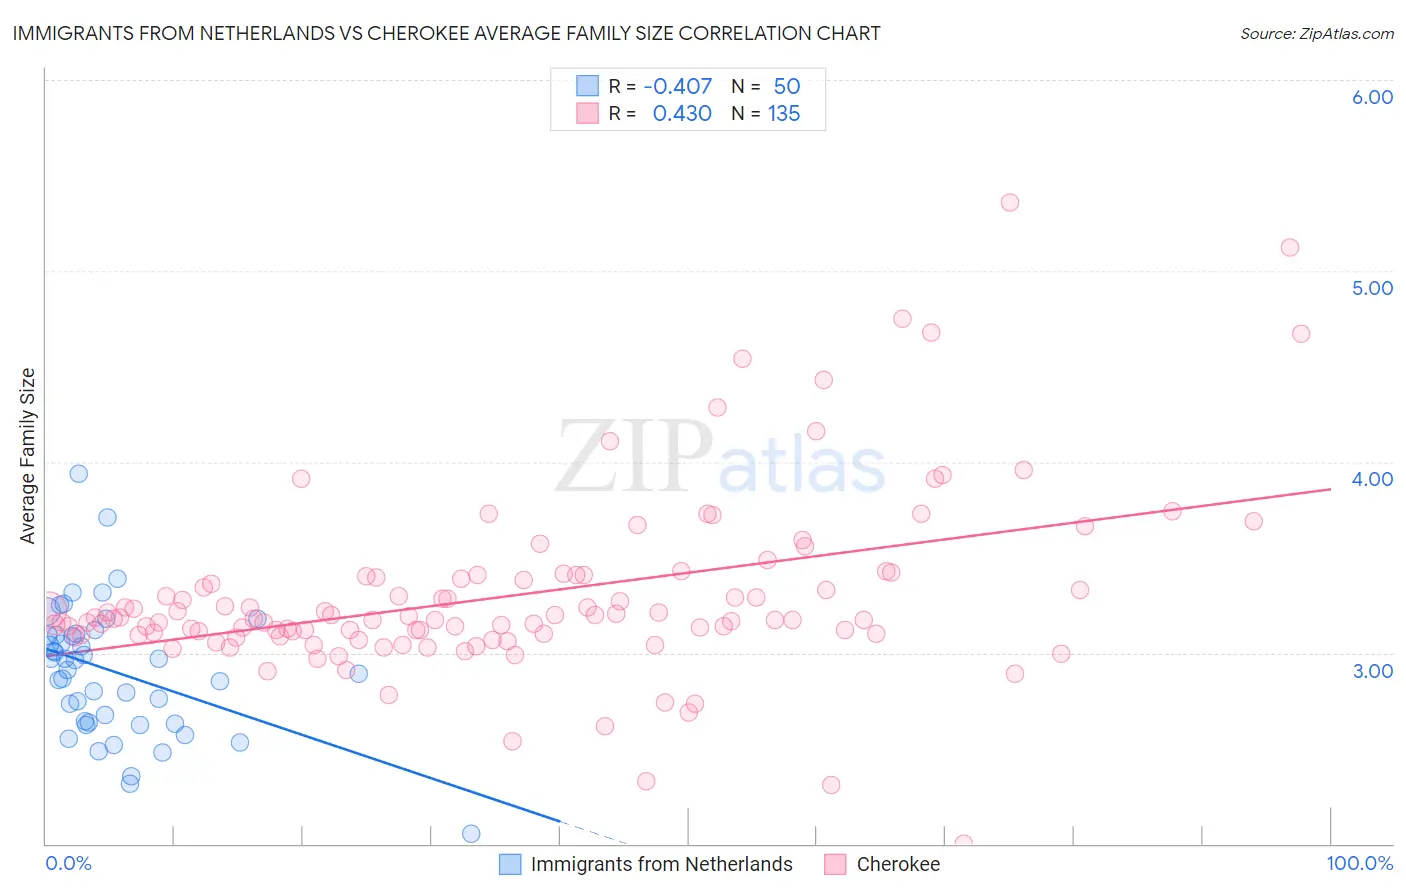
Immigrants from Netherlands vs Cherokee Average Family Size Correlation Chart
The statistical analysis conducted on geographies consisting of 237,802,006 people shows a moderate negative correlation between the proportion of Immigrants from Netherlands and average family size in the United States with a correlation coefficient (R) of -0.407 and weighted average of 3.14. Similarly, the statistical analysis conducted on geographies consisting of 493,383,050 people shows a moderate positive correlation between the proportion of Cherokee and average family size in the United States with a correlation coefficient (R) of 0.430 and weighted average of 3.18, a difference of 1.3%.
Average Family Size Correlation Summary
| Measurement | Immigrants from Netherlands | Cherokee |
| Minimum | 2.05 | 2.00 |
| Maximum | 3.94 | 5.36 |
| Range | 1.89 | 3.36 |
| Mean | 2.90 | 3.30 |
| Median | 2.94 | 3.18 |
| Interquartile 25% (IQ1) | 2.64 | 3.09 |
| Interquartile 75% (IQ3) | 3.09 | 3.40 |
| Interquartile Range (IQR) | 0.46 | 0.30 |
| Standard Deviation (Sample) | 0.35 | 0.48 |
| Standard Deviation (Population) | 0.34 | 0.48 |
Similar Demographics by Average Family Size
Demographics Similar to Immigrants from Netherlands by Average Family Size
In terms of average family size, the demographic groups most similar to Immigrants from Netherlands are Greek (3.14, a difference of 0.010%), Immigrants from Czechoslovakia (3.14, a difference of 0.010%), Immigrants from Norway (3.14, a difference of 0.010%), Cypriot (3.14, a difference of 0.040%), and White/Caucasian (3.14, a difference of 0.050%).
| Demographics | Rating | Rank | Average Family Size |
| Immigrants | Europe | 0.5 /100 | #279 | Tragic 3.15 |
| Immigrants | England | 0.4 /100 | #280 | Tragic 3.15 |
| Immigrants | Denmark | 0.4 /100 | #281 | Tragic 3.15 |
| Yugoslavians | 0.4 /100 | #282 | Tragic 3.15 |
| German Russians | 0.4 /100 | #283 | Tragic 3.15 |
| Immigrants | France | 0.4 /100 | #284 | Tragic 3.15 |
| Whites/Caucasians | 0.3 /100 | #285 | Tragic 3.14 |
| Immigrants | Netherlands | 0.3 /100 | #286 | Tragic 3.14 |
| Greeks | 0.3 /100 | #287 | Tragic 3.14 |
| Immigrants | Czechoslovakia | 0.3 /100 | #288 | Tragic 3.14 |
| Immigrants | Norway | 0.3 /100 | #289 | Tragic 3.14 |
| Cypriots | 0.3 /100 | #290 | Tragic 3.14 |
| Alsatians | 0.2 /100 | #291 | Tragic 3.14 |
| Europeans | 0.2 /100 | #292 | Tragic 3.14 |
| Scandinavians | 0.2 /100 | #293 | Tragic 3.14 |
Demographics Similar to Cherokee by Average Family Size
In terms of average family size, the demographic groups most similar to Cherokee are Brazilian (3.18, a difference of 0.020%), Iranian (3.18, a difference of 0.030%), Icelander (3.19, a difference of 0.040%), Basque (3.19, a difference of 0.040%), and Immigrants from Turkey (3.18, a difference of 0.050%).
| Demographics | Rating | Rank | Average Family Size |
| Cree | 6.2 /100 | #225 | Tragic 3.19 |
| Chickasaw | 6.0 /100 | #226 | Tragic 3.19 |
| Portuguese | 6.0 /100 | #227 | Tragic 3.19 |
| Immigrants | Nonimmigrants | 5.7 /100 | #228 | Tragic 3.19 |
| Immigrants | Italy | 5.3 /100 | #229 | Tragic 3.19 |
| Icelanders | 5.2 /100 | #230 | Tragic 3.19 |
| Basques | 5.2 /100 | #231 | Tragic 3.19 |
| Cherokee | 4.7 /100 | #232 | Tragic 3.18 |
| Brazilians | 4.5 /100 | #233 | Tragic 3.18 |
| Iranians | 4.5 /100 | #234 | Tragic 3.18 |
| Immigrants | Turkey | 4.2 /100 | #235 | Tragic 3.18 |
| Immigrants | Portugal | 4.2 /100 | #236 | Tragic 3.18 |
| Immigrants | Romania | 3.7 /100 | #237 | Tragic 3.18 |
| Romanians | 3.7 /100 | #238 | Tragic 3.18 |
| Houma | 3.4 /100 | #239 | Tragic 3.18 |