Immigrants from North Macedonia vs Bulgarian Births to Unmarried Women
COMPARE
Immigrants from North Macedonia
Bulgarian
Births to Unmarried Women
Births to Unmarried Women Comparison
Immigrants from North Macedonia
Bulgarians
28.1%
BIRTHS TO UNMARRIED WOMEN
99.1/ 100
METRIC RATING
61st/ 347
METRIC RANK
27.1%
BIRTHS TO UNMARRIED WOMEN
99.8/ 100
METRIC RATING
30th/ 347
METRIC RANK
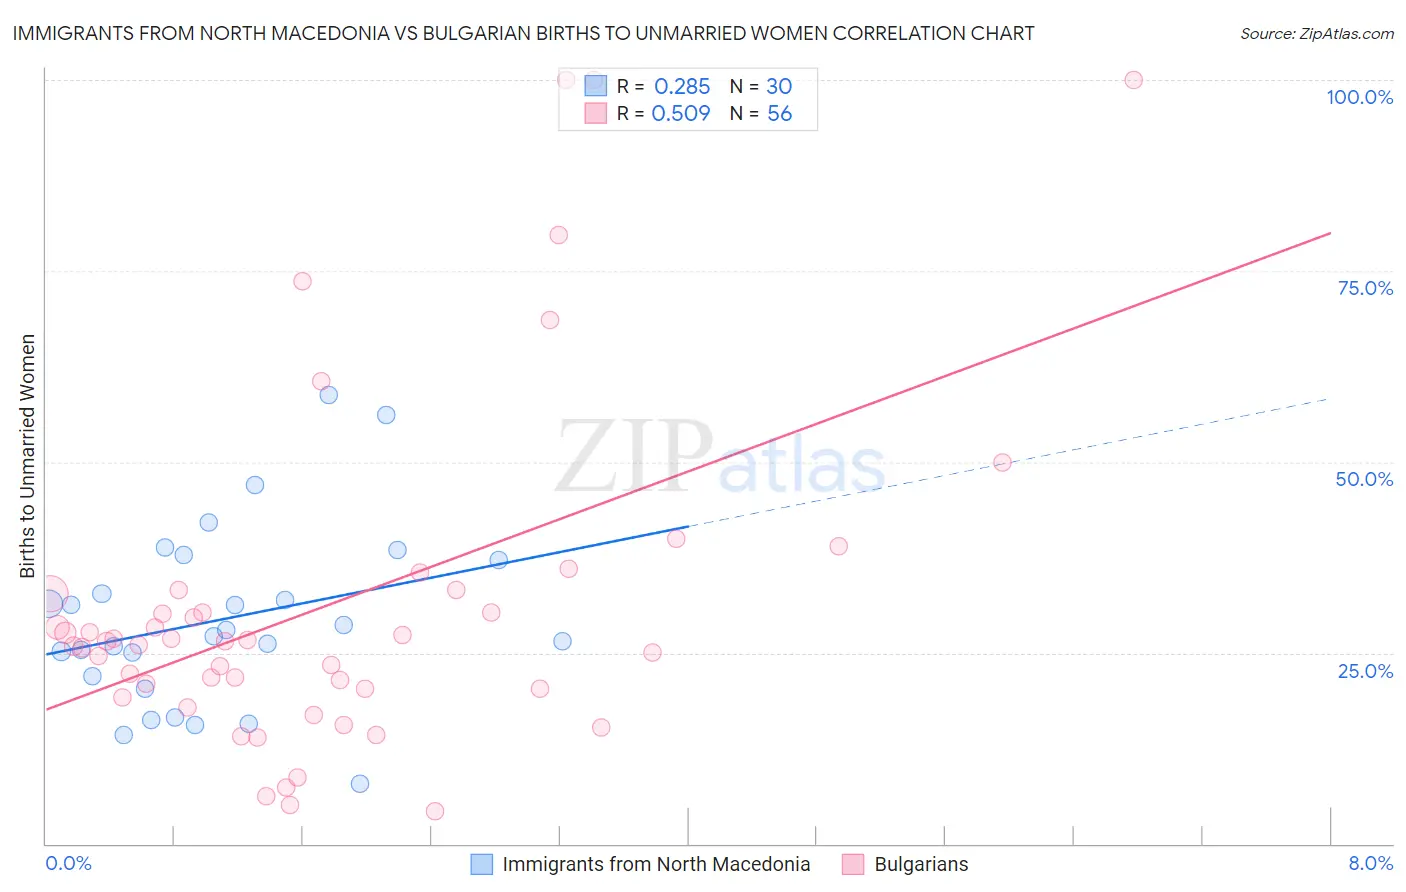
Immigrants from North Macedonia vs Bulgarian Births to Unmarried Women Correlation Chart
The statistical analysis conducted on geographies consisting of 71,828,826 people shows a weak positive correlation between the proportion of Immigrants from North Macedonia and percentage of births to unmarried women in the United States with a correlation coefficient (R) of 0.285 and weighted average of 28.1%. Similarly, the statistical analysis conducted on geographies consisting of 195,514,672 people shows a substantial positive correlation between the proportion of Bulgarians and percentage of births to unmarried women in the United States with a correlation coefficient (R) of 0.509 and weighted average of 27.1%, a difference of 4.0%.
Births to Unmarried Women Correlation Summary
| Measurement | Immigrants from North Macedonia | Bulgarian |
| Minimum | 7.8% | 4.2% |
| Maximum | 58.8% | 100.0% |
| Range | 51.0% | 95.8% |
| Mean | 29.4% | 31.4% |
| Median | 27.6% | 26.5% |
| Interquartile 25% (IQ1) | 22.0% | 20.3% |
| Interquartile 75% (IQ3) | 37.2% | 33.0% |
| Interquartile Range (IQR) | 15.2% | 12.7% |
| Standard Deviation (Sample) | 11.8% | 22.3% |
| Standard Deviation (Population) | 11.6% | 22.1% |
Similar Demographics by Births to Unmarried Women
Demographics Similar to Immigrants from North Macedonia by Births to Unmarried Women
In terms of births to unmarried women, the demographic groups most similar to Immigrants from North Macedonia are Immigrants from Turkey (28.1%, a difference of 0.040%), Immigrants from Kazakhstan (28.1%, a difference of 0.090%), Egyptian (28.2%, a difference of 0.32%), Immigrants from Albania (28.0%, a difference of 0.34%), and Russian (28.0%, a difference of 0.45%).
| Demographics | Rating | Rank | Births to Unmarried Women |
| Afghans | 99.4 /100 | #54 | Exceptional 27.9% |
| Mongolians | 99.3 /100 | #55 | Exceptional 27.9% |
| Immigrants | Belgium | 99.3 /100 | #56 | Exceptional 28.0% |
| Russians | 99.2 /100 | #57 | Exceptional 28.0% |
| Immigrants | Albania | 99.2 /100 | #58 | Exceptional 28.0% |
| Immigrants | Kazakhstan | 99.1 /100 | #59 | Exceptional 28.1% |
| Immigrants | Turkey | 99.1 /100 | #60 | Exceptional 28.1% |
| Immigrants | North Macedonia | 99.1 /100 | #61 | Exceptional 28.1% |
| Egyptians | 99.0 /100 | #62 | Exceptional 28.2% |
| Immigrants | Serbia | 98.9 /100 | #63 | Exceptional 28.3% |
| Tongans | 98.8 /100 | #64 | Exceptional 28.4% |
| Immigrants | Czechoslovakia | 98.8 /100 | #65 | Exceptional 28.4% |
| Immigrants | Egypt | 98.8 /100 | #66 | Exceptional 28.4% |
| Palestinians | 98.7 /100 | #67 | Exceptional 28.4% |
| Immigrants | Europe | 98.7 /100 | #68 | Exceptional 28.4% |
Demographics Similar to Bulgarians by Births to Unmarried Women
In terms of births to unmarried women, the demographic groups most similar to Bulgarians are Cypriot (27.0%, a difference of 0.16%), Immigrants from Iraq (27.1%, a difference of 0.29%), Immigrants from Russia (27.1%, a difference of 0.32%), Immigrants from Sri Lanka (27.2%, a difference of 0.39%), and Immigrants from Pakistan (27.2%, a difference of 0.43%).
| Demographics | Rating | Rank | Births to Unmarried Women |
| Immigrants | Japan | 99.9 /100 | #23 | Exceptional 26.4% |
| Immigrants | Australia | 99.9 /100 | #24 | Exceptional 26.6% |
| Cambodians | 99.9 /100 | #25 | Exceptional 26.7% |
| Asians | 99.9 /100 | #26 | Exceptional 26.8% |
| Immigrants | Asia | 99.9 /100 | #27 | Exceptional 26.8% |
| Okinawans | 99.8 /100 | #28 | Exceptional 26.9% |
| Cypriots | 99.8 /100 | #29 | Exceptional 27.0% |
| Bulgarians | 99.8 /100 | #30 | Exceptional 27.1% |
| Immigrants | Iraq | 99.8 /100 | #31 | Exceptional 27.1% |
| Immigrants | Russia | 99.8 /100 | #32 | Exceptional 27.1% |
| Immigrants | Sri Lanka | 99.8 /100 | #33 | Exceptional 27.2% |
| Immigrants | Pakistan | 99.8 /100 | #34 | Exceptional 27.2% |
| Immigrants | Ireland | 99.7 /100 | #35 | Exceptional 27.2% |
| Immigrants | Western Asia | 99.7 /100 | #36 | Exceptional 27.2% |
| Immigrants | Ukraine | 99.7 /100 | #37 | Exceptional 27.2% |