Immigrants from Panama vs Yakama Currently Married
COMPARE
Immigrants from Panama
Yakama
Currently Married
Currently Married Comparison
Immigrants from Panama
Yakama
44.9%
CURRENTLY MARRIED
1.5/ 100
METRIC RATING
231st/ 347
METRIC RANK
44.0%
CURRENTLY MARRIED
0.2/ 100
METRIC RATING
255th/ 347
METRIC RANK
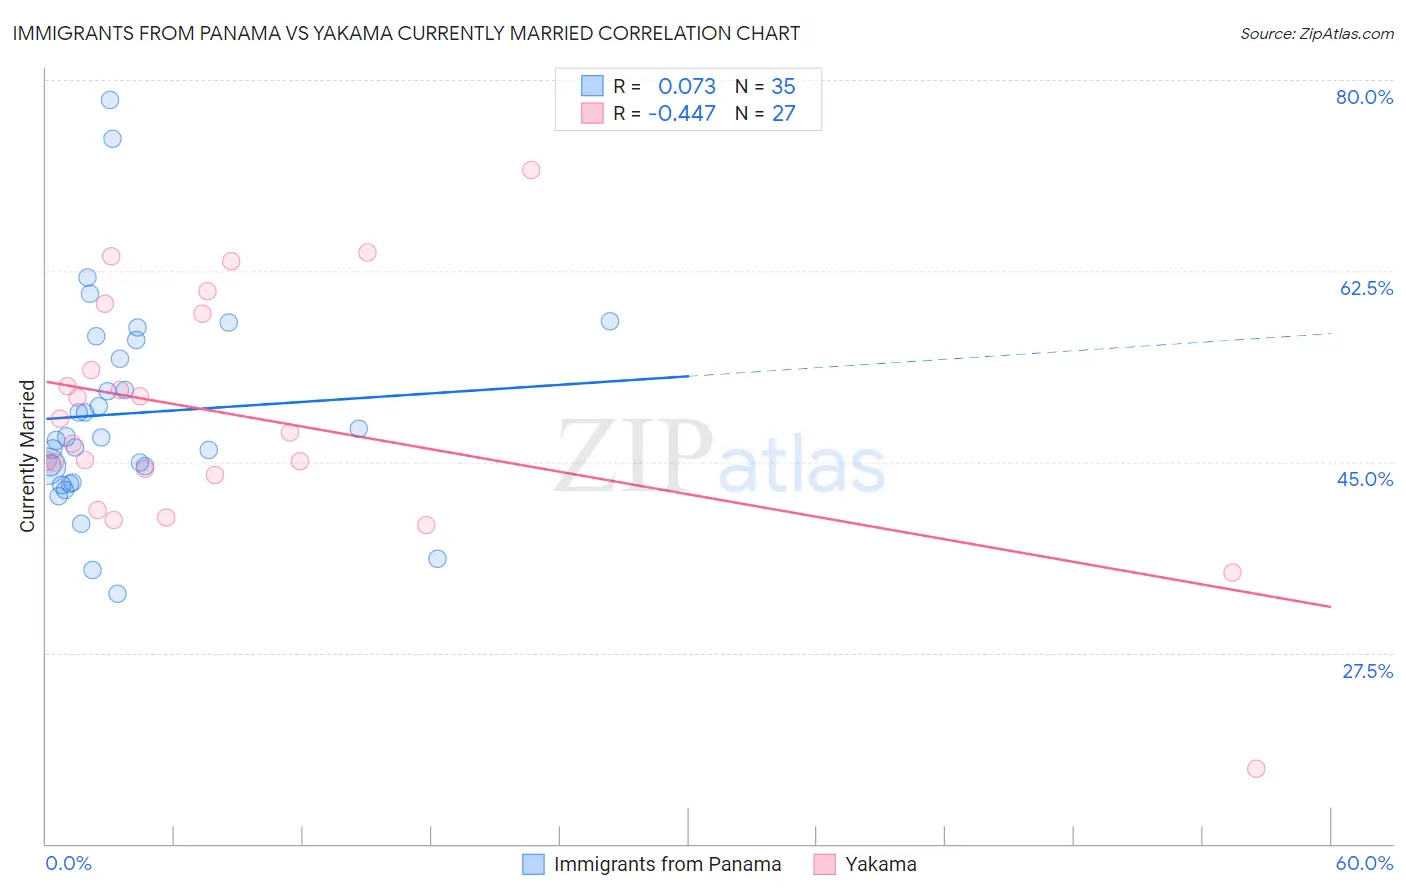
Immigrants from Panama vs Yakama Currently Married Correlation Chart
The statistical analysis conducted on geographies consisting of 221,180,776 people shows a slight positive correlation between the proportion of Immigrants from Panama and percentage of population currently married in the United States with a correlation coefficient (R) of 0.073 and weighted average of 44.9%. Similarly, the statistical analysis conducted on geographies consisting of 19,923,144 people shows a moderate negative correlation between the proportion of Yakama and percentage of population currently married in the United States with a correlation coefficient (R) of -0.447 and weighted average of 44.0%, a difference of 2.0%.
Currently Married Correlation Summary
| Measurement | Immigrants from Panama | Yakama |
| Minimum | 32.9% | 16.9% |
| Maximum | 78.2% | 71.8% |
| Range | 45.3% | 54.9% |
| Mean | 49.5% | 49.0% |
| Median | 47.2% | 47.7% |
| Interquartile 25% (IQ1) | 43.1% | 43.8% |
| Interquartile 75% (IQ3) | 56.2% | 58.6% |
| Interquartile Range (IQR) | 13.1% | 14.8% |
| Standard Deviation (Sample) | 9.7% | 11.2% |
| Standard Deviation (Population) | 9.6% | 11.0% |
Similar Demographics by Currently Married
Demographics Similar to Immigrants from Panama by Currently Married
In terms of currently married, the demographic groups most similar to Immigrants from Panama are Immigrants from Kenya (44.9%, a difference of 0.040%), Cree (44.9%, a difference of 0.080%), Nepalese (44.7%, a difference of 0.26%), Spanish American (45.0%, a difference of 0.27%), and Immigrants from Uruguay (45.0%, a difference of 0.27%).
| Demographics | Rating | Rank | Currently Married |
| Immigrants | Uganda | 2.2 /100 | #224 | Tragic 45.0% |
| French American Indians | 2.2 /100 | #225 | Tragic 45.0% |
| Comanche | 2.1 /100 | #226 | Tragic 45.0% |
| Spanish Americans | 2.1 /100 | #227 | Tragic 45.0% |
| Immigrants | Uruguay | 2.0 /100 | #228 | Tragic 45.0% |
| Cree | 1.7 /100 | #229 | Tragic 44.9% |
| Immigrants | Kenya | 1.6 /100 | #230 | Tragic 44.9% |
| Immigrants | Panama | 1.5 /100 | #231 | Tragic 44.9% |
| Nepalese | 1.2 /100 | #232 | Tragic 44.7% |
| Immigrants | Saudi Arabia | 1.1 /100 | #233 | Tragic 44.7% |
| Iroquois | 1.1 /100 | #234 | Tragic 44.7% |
| Alaskan Athabascans | 0.9 /100 | #235 | Tragic 44.6% |
| Cubans | 0.9 /100 | #236 | Tragic 44.6% |
| Seminole | 0.9 /100 | #237 | Tragic 44.6% |
| Moroccans | 0.9 /100 | #238 | Tragic 44.6% |
Demographics Similar to Yakama by Currently Married
In terms of currently married, the demographic groups most similar to Yakama are Shoshone (44.0%, a difference of 0.050%), Vietnamese (44.0%, a difference of 0.070%), Immigrants from Africa (43.9%, a difference of 0.25%), Ute (43.9%, a difference of 0.26%), and Immigrants from Central America (44.1%, a difference of 0.32%).
| Demographics | Rating | Rank | Currently Married |
| Nicaraguans | 0.3 /100 | #248 | Tragic 44.2% |
| Immigrants | Cameroon | 0.3 /100 | #249 | Tragic 44.2% |
| Immigrants | Eastern Africa | 0.3 /100 | #250 | Tragic 44.2% |
| Blackfeet | 0.3 /100 | #251 | Tragic 44.2% |
| Hispanics or Latinos | 0.3 /100 | #252 | Tragic 44.1% |
| Immigrants | Central America | 0.3 /100 | #253 | Tragic 44.1% |
| Vietnamese | 0.2 /100 | #254 | Tragic 44.0% |
| Yakama | 0.2 /100 | #255 | Tragic 44.0% |
| Shoshone | 0.2 /100 | #256 | Tragic 44.0% |
| Immigrants | Africa | 0.2 /100 | #257 | Tragic 43.9% |
| Ute | 0.2 /100 | #258 | Tragic 43.9% |
| Immigrants | Sierra Leone | 0.1 /100 | #259 | Tragic 43.8% |
| Immigrants | Latin America | 0.1 /100 | #260 | Tragic 43.8% |
| Immigrants | Nicaragua | 0.1 /100 | #261 | Tragic 43.7% |
| Bangladeshis | 0.1 /100 | #262 | Tragic 43.7% |