Immigrants from Portugal vs Belgian Births to Unmarried Women
COMPARE
Immigrants from Portugal
Belgian
Births to Unmarried Women
Births to Unmarried Women Comparison
Immigrants from Portugal
Belgians
36.2%
BIRTHS TO UNMARRIED WOMEN
0.2/ 100
METRIC RATING
253rd/ 347
METRIC RANK
31.6%
BIRTHS TO UNMARRIED WOMEN
52.4/ 100
METRIC RATING
168th/ 347
METRIC RANK
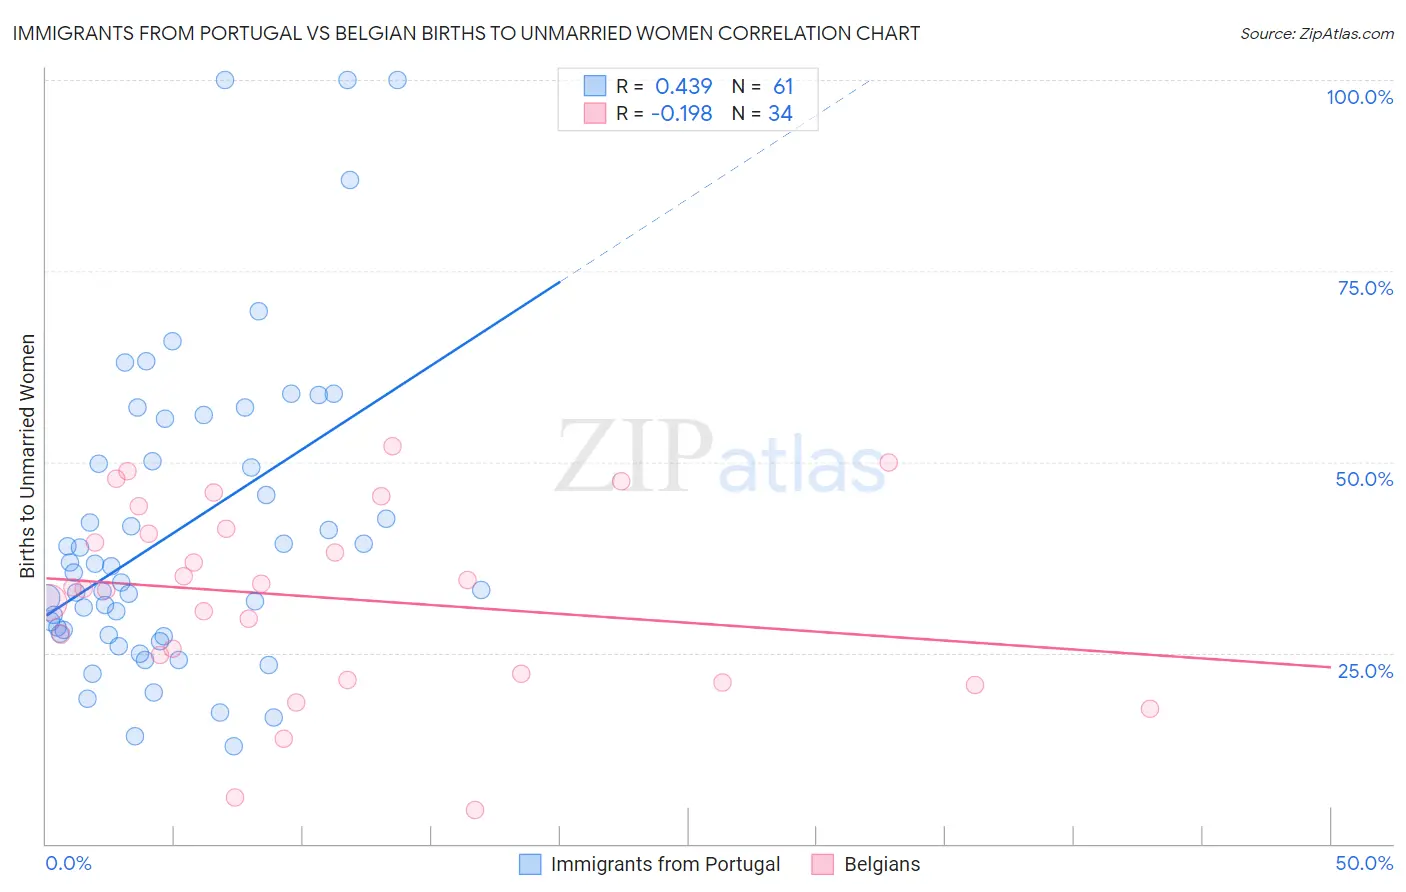
Immigrants from Portugal vs Belgian Births to Unmarried Women Correlation Chart
The statistical analysis conducted on geographies consisting of 165,718,772 people shows a moderate positive correlation between the proportion of Immigrants from Portugal and percentage of births to unmarried women in the United States with a correlation coefficient (R) of 0.439 and weighted average of 36.2%. Similarly, the statistical analysis conducted on geographies consisting of 329,841,435 people shows a poor negative correlation between the proportion of Belgians and percentage of births to unmarried women in the United States with a correlation coefficient (R) of -0.198 and weighted average of 31.6%, a difference of 14.4%.
Births to Unmarried Women Correlation Summary
| Measurement | Immigrants from Portugal | Belgian |
| Minimum | 12.7% | 4.4% |
| Maximum | 100.0% | 52.0% |
| Range | 87.3% | 47.6% |
| Mean | 41.1% | 32.3% |
| Median | 35.5% | 33.5% |
| Interquartile 25% (IQ1) | 27.5% | 22.3% |
| Interquartile 75% (IQ3) | 52.9% | 41.2% |
| Interquartile Range (IQR) | 25.4% | 19.0% |
| Standard Deviation (Sample) | 20.3% | 12.4% |
| Standard Deviation (Population) | 20.1% | 12.2% |
Similar Demographics by Births to Unmarried Women
Demographics Similar to Immigrants from Portugal by Births to Unmarried Women
In terms of births to unmarried women, the demographic groups most similar to Immigrants from Portugal are Potawatomi (36.2%, a difference of 0.22%), Chickasaw (36.3%, a difference of 0.36%), Immigrants from Trinidad and Tobago (36.3%, a difference of 0.36%), Immigrants from Grenada (36.3%, a difference of 0.39%), and Salvadoran (36.0%, a difference of 0.46%).
| Demographics | Rating | Rank | Births to Unmarried Women |
| Nigerians | 0.7 /100 | #246 | Tragic 35.3% |
| Immigrants | Nigeria | 0.7 /100 | #247 | Tragic 35.4% |
| Immigrants | Nonimmigrants | 0.6 /100 | #248 | Tragic 35.5% |
| Bermudans | 0.6 /100 | #249 | Tragic 35.5% |
| Mexican American Indians | 0.4 /100 | #250 | Tragic 35.7% |
| Immigrants | Western Africa | 0.3 /100 | #251 | Tragic 36.0% |
| Salvadorans | 0.3 /100 | #252 | Tragic 36.0% |
| Immigrants | Portugal | 0.2 /100 | #253 | Tragic 36.2% |
| Potawatomi | 0.2 /100 | #254 | Tragic 36.2% |
| Chickasaw | 0.2 /100 | #255 | Tragic 36.3% |
| Immigrants | Trinidad and Tobago | 0.2 /100 | #256 | Tragic 36.3% |
| Immigrants | Grenada | 0.2 /100 | #257 | Tragic 36.3% |
| Americans | 0.2 /100 | #258 | Tragic 36.4% |
| Immigrants | El Salvador | 0.2 /100 | #259 | Tragic 36.4% |
| Ottawa | 0.2 /100 | #260 | Tragic 36.5% |
Demographics Similar to Belgians by Births to Unmarried Women
In terms of births to unmarried women, the demographic groups most similar to Belgians are Slavic (31.6%, a difference of 0.030%), Guamanian/Chamorro (31.6%, a difference of 0.10%), Finnish (31.7%, a difference of 0.18%), Immigrants from Eritrea (31.7%, a difference of 0.19%), and Immigrants from Yemen (31.7%, a difference of 0.20%).
| Demographics | Rating | Rank | Births to Unmarried Women |
| Immigrants | Southern Europe | 68.7 /100 | #161 | Good 31.1% |
| Slovenes | 65.9 /100 | #162 | Good 31.2% |
| Immigrants | Chile | 65.7 /100 | #163 | Good 31.2% |
| Hungarians | 64.1 /100 | #164 | Good 31.2% |
| Immigrants | Somalia | 58.1 /100 | #165 | Average 31.4% |
| Peruvians | 55.5 /100 | #166 | Average 31.5% |
| Dutch | 55.3 /100 | #167 | Average 31.5% |
| Belgians | 52.4 /100 | #168 | Average 31.6% |
| Slavs | 52.0 /100 | #169 | Average 31.6% |
| Guamanians/Chamorros | 51.3 /100 | #170 | Average 31.6% |
| Finns | 50.5 /100 | #171 | Average 31.7% |
| Immigrants | Eritrea | 50.4 /100 | #172 | Average 31.7% |
| Immigrants | Yemen | 50.2 /100 | #173 | Average 31.7% |
| Venezuelans | 50.0 /100 | #174 | Average 31.7% |
| Immigrants | Venezuela | 49.2 /100 | #175 | Average 31.7% |