Immigrants from Romania vs Slovene Married-couple Households
COMPARE
Immigrants from Romania
Slovene
Married-couple Households
Married-couple Households Comparison
Immigrants from Romania
Slovenes
48.3%
MARRIED-COUPLE HOUSEHOLDS
98.6/ 100
METRIC RATING
74th/ 347
METRIC RANK
47.1%
MARRIED-COUPLE HOUSEHOLDS
81.7/ 100
METRIC RATING
145th/ 347
METRIC RANK
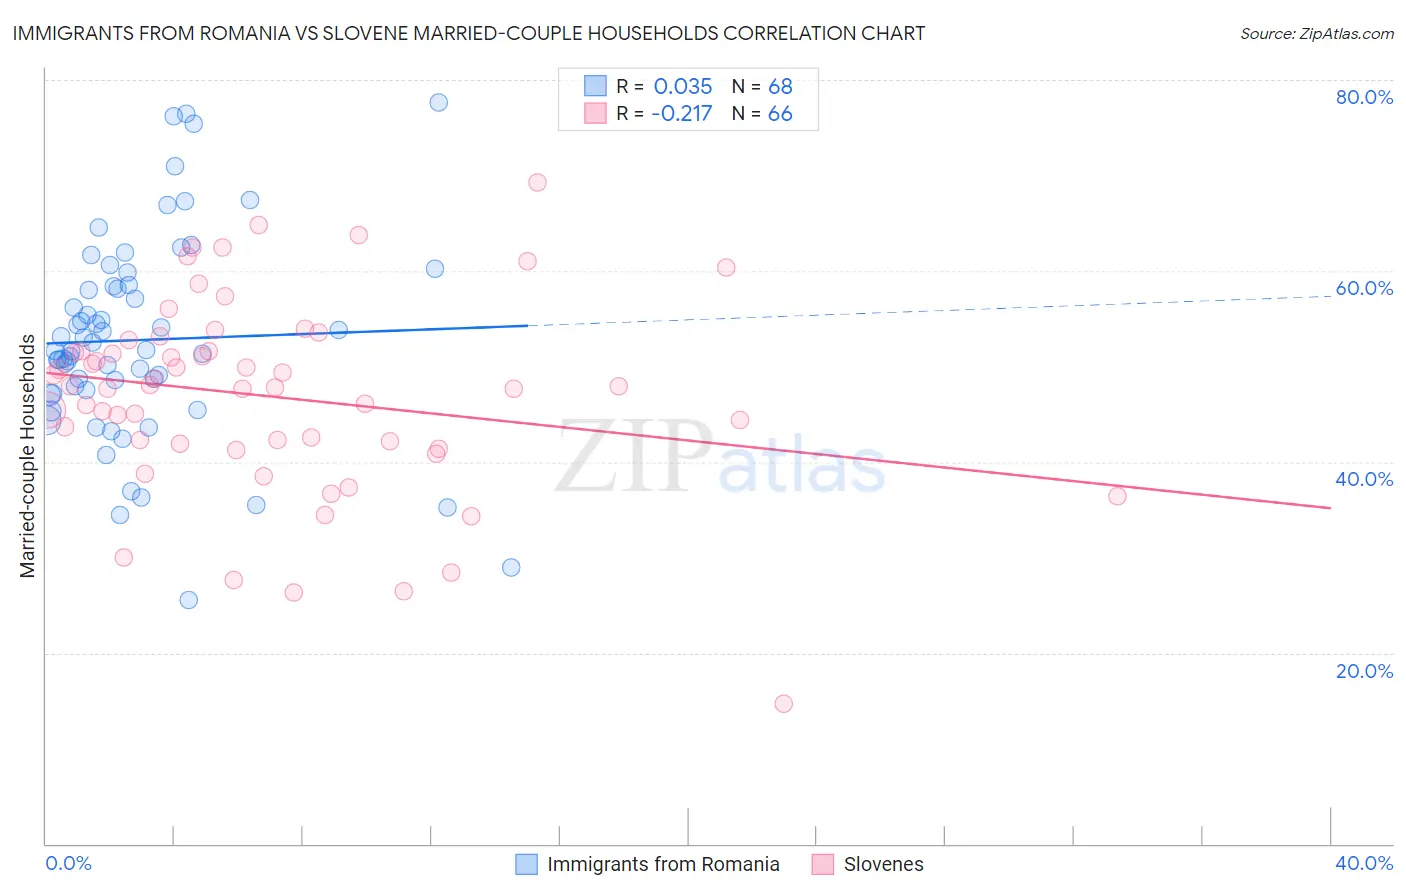
Immigrants from Romania vs Slovene Married-couple Households Correlation Chart
The statistical analysis conducted on geographies consisting of 256,957,866 people shows no correlation between the proportion of Immigrants from Romania and percentage of married-couple family households in the United States with a correlation coefficient (R) of 0.035 and weighted average of 48.3%. Similarly, the statistical analysis conducted on geographies consisting of 261,254,206 people shows a weak negative correlation between the proportion of Slovenes and percentage of married-couple family households in the United States with a correlation coefficient (R) of -0.217 and weighted average of 47.1%, a difference of 2.5%.
Married-couple Households Correlation Summary
| Measurement | Immigrants from Romania | Slovene |
| Minimum | 25.5% | 14.6% |
| Maximum | 77.6% | 69.2% |
| Range | 52.1% | 54.6% |
| Mean | 52.8% | 46.8% |
| Median | 51.7% | 47.8% |
| Interquartile 25% (IQ1) | 47.3% | 41.8% |
| Interquartile 75% (IQ3) | 58.5% | 51.6% |
| Interquartile Range (IQR) | 11.2% | 9.7% |
| Standard Deviation (Sample) | 10.7% | 10.2% |
| Standard Deviation (Population) | 10.7% | 10.1% |
Similar Demographics by Married-couple Households
Demographics Similar to Immigrants from Romania by Married-couple Households
In terms of married-couple households, the demographic groups most similar to Immigrants from Romania are Immigrants from Singapore (48.3%, a difference of 0.010%), Scotch-Irish (48.3%, a difference of 0.040%), Immigrants from England (48.2%, a difference of 0.090%), Immigrants from Fiji (48.2%, a difference of 0.090%), and Canadian (48.2%, a difference of 0.19%).
| Demographics | Rating | Rank | Married-couple Households |
| Romanians | 98.9 /100 | #67 | Exceptional 48.4% |
| Immigrants | South Eastern Asia | 98.9 /100 | #68 | Exceptional 48.4% |
| Immigrants | China | 98.9 /100 | #69 | Exceptional 48.4% |
| Immigrants | North America | 98.9 /100 | #70 | Exceptional 48.4% |
| Laotians | 98.8 /100 | #71 | Exceptional 48.4% |
| Scotch-Irish | 98.6 /100 | #72 | Exceptional 48.3% |
| Immigrants | Singapore | 98.6 /100 | #73 | Exceptional 48.3% |
| Immigrants | Romania | 98.6 /100 | #74 | Exceptional 48.3% |
| Immigrants | England | 98.4 /100 | #75 | Exceptional 48.2% |
| Immigrants | Fiji | 98.4 /100 | #76 | Exceptional 48.2% |
| Canadians | 98.2 /100 | #77 | Exceptional 48.2% |
| Egyptians | 98.2 /100 | #78 | Exceptional 48.2% |
| Immigrants | Netherlands | 98.2 /100 | #79 | Exceptional 48.2% |
| Russians | 98.1 /100 | #80 | Exceptional 48.2% |
| Finns | 98.0 /100 | #81 | Exceptional 48.1% |
Demographics Similar to Slovenes by Married-couple Households
In terms of married-couple households, the demographic groups most similar to Slovenes are Immigrants from Western Europe (47.1%, a difference of 0.0%), Immigrants from Syria (47.1%, a difference of 0.010%), Mexican (47.1%, a difference of 0.11%), Icelander (47.0%, a difference of 0.13%), and Immigrants from Belarus (47.2%, a difference of 0.14%).
| Demographics | Rating | Rank | Married-couple Households |
| Immigrants | Afghanistan | 85.1 /100 | #138 | Excellent 47.2% |
| Immigrants | Sweden | 84.7 /100 | #139 | Excellent 47.2% |
| Spanish | 84.5 /100 | #140 | Excellent 47.2% |
| Costa Ricans | 84.4 /100 | #141 | Excellent 47.2% |
| Spaniards | 84.1 /100 | #142 | Excellent 47.2% |
| Immigrants | Belarus | 83.8 /100 | #143 | Excellent 47.2% |
| Mexicans | 83.4 /100 | #144 | Excellent 47.1% |
| Slovenes | 81.7 /100 | #145 | Excellent 47.1% |
| Immigrants | Western Europe | 81.6 /100 | #146 | Excellent 47.1% |
| Immigrants | Syria | 81.6 /100 | #147 | Excellent 47.1% |
| Icelanders | 79.5 /100 | #148 | Good 47.0% |
| Paraguayans | 78.7 /100 | #149 | Good 47.0% |
| Immigrants | Russia | 77.6 /100 | #150 | Good 47.0% |
| Immigrants | Bulgaria | 76.8 /100 | #151 | Good 47.0% |
| Serbians | 76.3 /100 | #152 | Good 47.0% |