Immigrants from Trinidad and Tobago vs Asian Currently Married
COMPARE
Immigrants from Trinidad and Tobago
Asian
Currently Married
Currently Married Comparison
Immigrants from Trinidad and Tobago
Asians
41.9%
CURRENTLY MARRIED
0.0/ 100
METRIC RATING
305th/ 347
METRIC RANK
48.4%
CURRENTLY MARRIED
98.5/ 100
METRIC RATING
62nd/ 347
METRIC RANK
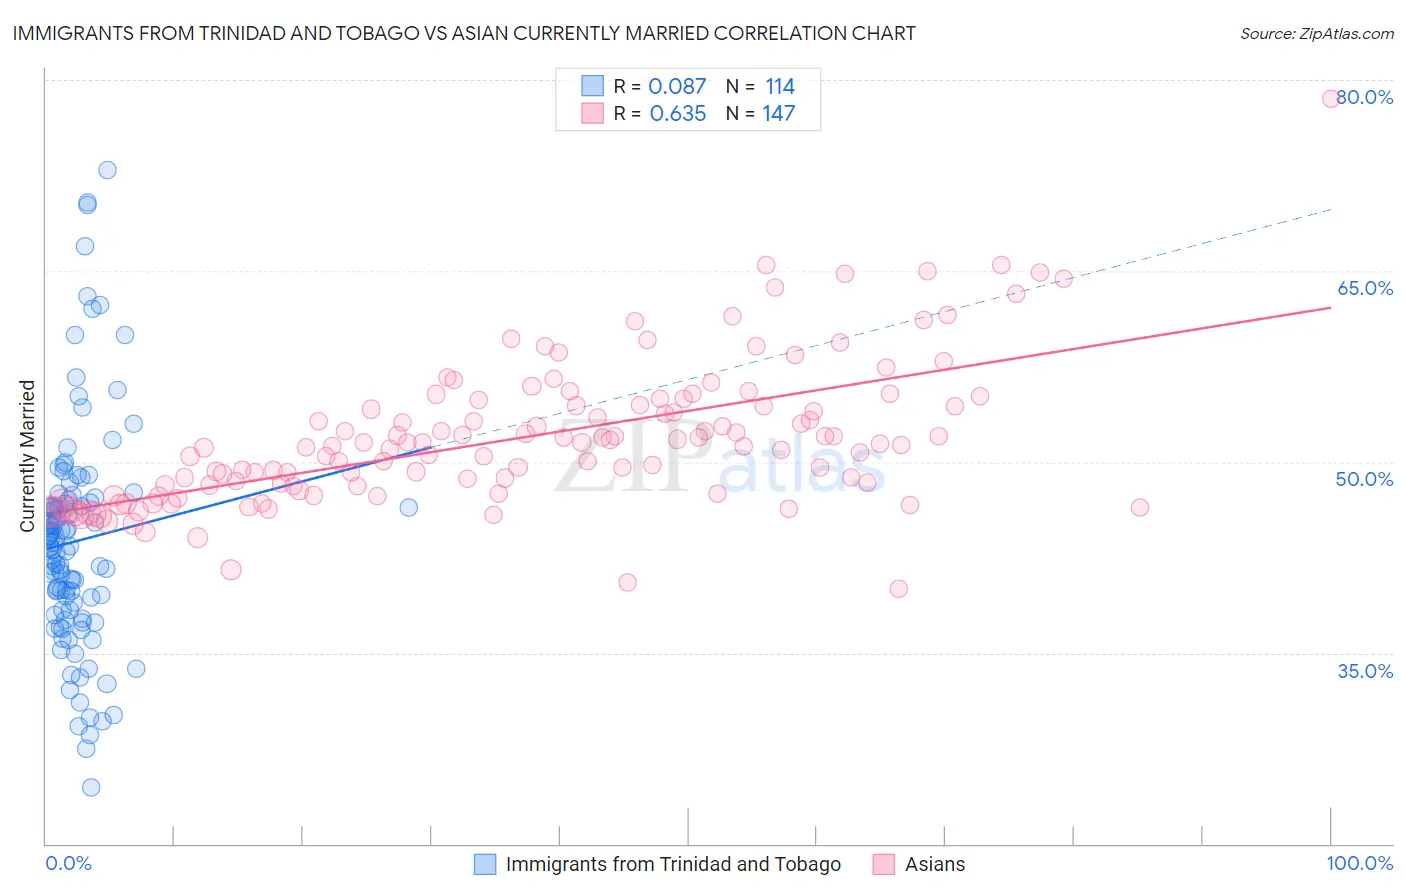
Immigrants from Trinidad and Tobago vs Asian Currently Married Correlation Chart
The statistical analysis conducted on geographies consisting of 223,527,783 people shows a slight positive correlation between the proportion of Immigrants from Trinidad and Tobago and percentage of population currently married in the United States with a correlation coefficient (R) of 0.087 and weighted average of 41.9%. Similarly, the statistical analysis conducted on geographies consisting of 550,785,629 people shows a significant positive correlation between the proportion of Asians and percentage of population currently married in the United States with a correlation coefficient (R) of 0.635 and weighted average of 48.4%, a difference of 15.6%.
Currently Married Correlation Summary
| Measurement | Immigrants from Trinidad and Tobago | Asian |
| Minimum | 24.4% | 40.0% |
| Maximum | 72.9% | 78.5% |
| Range | 48.5% | 38.5% |
| Mean | 43.8% | 51.9% |
| Median | 43.4% | 51.4% |
| Interquartile 25% (IQ1) | 38.3% | 48.1% |
| Interquartile 75% (IQ3) | 47.0% | 54.5% |
| Interquartile Range (IQR) | 8.7% | 6.4% |
| Standard Deviation (Sample) | 8.9% | 5.7% |
| Standard Deviation (Population) | 8.9% | 5.7% |
Similar Demographics by Currently Married
Demographics Similar to Immigrants from Trinidad and Tobago by Currently Married
In terms of currently married, the demographic groups most similar to Immigrants from Trinidad and Tobago are Immigrants from Guyana (41.9%, a difference of 0.010%), Immigrants from Bahamas (41.9%, a difference of 0.030%), African (41.8%, a difference of 0.14%), Sioux (41.9%, a difference of 0.15%), and Immigrants from Zaire (42.0%, a difference of 0.16%).
| Demographics | Rating | Rank | Currently Married |
| Immigrants | Honduras | 0.0 /100 | #298 | Tragic 42.2% |
| Liberians | 0.0 /100 | #299 | Tragic 42.2% |
| Belizeans | 0.0 /100 | #300 | Tragic 42.2% |
| Immigrants | Yemen | 0.0 /100 | #301 | Tragic 42.1% |
| Immigrants | Zaire | 0.0 /100 | #302 | Tragic 42.0% |
| Sioux | 0.0 /100 | #303 | Tragic 41.9% |
| Immigrants | Bahamas | 0.0 /100 | #304 | Tragic 41.9% |
| Immigrants | Trinidad and Tobago | 0.0 /100 | #305 | Tragic 41.9% |
| Immigrants | Guyana | 0.0 /100 | #306 | Tragic 41.9% |
| Africans | 0.0 /100 | #307 | Tragic 41.8% |
| Immigrants | Belize | 0.0 /100 | #308 | Tragic 41.8% |
| Immigrants | Liberia | 0.0 /100 | #309 | Tragic 41.8% |
| Guyanese | 0.0 /100 | #310 | Tragic 41.6% |
| Trinidadians and Tobagonians | 0.0 /100 | #311 | Tragic 41.5% |
| Somalis | 0.0 /100 | #312 | Tragic 41.5% |
Demographics Similar to Asians by Currently Married
In terms of currently married, the demographic groups most similar to Asians are Romanian (48.4%, a difference of 0.0%), Immigrants from Romania (48.4%, a difference of 0.010%), Immigrants from Ireland (48.4%, a difference of 0.030%), French (48.4%, a difference of 0.060%), and Immigrants from Netherlands (48.5%, a difference of 0.10%).
| Demographics | Rating | Rank | Currently Married |
| Immigrants | North Macedonia | 98.7 /100 | #55 | Exceptional 48.5% |
| Latvians | 98.7 /100 | #56 | Exceptional 48.5% |
| Immigrants | Netherlands | 98.6 /100 | #57 | Exceptional 48.5% |
| French | 98.6 /100 | #58 | Exceptional 48.4% |
| Immigrants | Ireland | 98.5 /100 | #59 | Exceptional 48.4% |
| Immigrants | Romania | 98.5 /100 | #60 | Exceptional 48.4% |
| Romanians | 98.5 /100 | #61 | Exceptional 48.4% |
| Asians | 98.5 /100 | #62 | Exceptional 48.4% |
| Slavs | 98.3 /100 | #63 | Exceptional 48.4% |
| Immigrants | Czechoslovakia | 98.3 /100 | #64 | Exceptional 48.4% |
| Ukrainians | 98.3 /100 | #65 | Exceptional 48.4% |
| Tongans | 98.2 /100 | #66 | Exceptional 48.3% |
| Slovaks | 98.2 /100 | #67 | Exceptional 48.3% |
| Immigrants | England | 98.2 /100 | #68 | Exceptional 48.3% |
| Canadians | 98.1 /100 | #69 | Exceptional 48.3% |