Immigrants from Ukraine vs Zimbabwean Average Family Size
COMPARE
Immigrants from Ukraine
Zimbabwean
Average Family Size
Average Family Size Comparison
Immigrants from Ukraine
Zimbabweans
3.19
AVERAGE FAMILY SIZE
7.2/ 100
METRIC RATING
221st/ 347
METRIC RANK
3.20
AVERAGE FAMILY SIZE
12.6/ 100
METRIC RATING
210th/ 347
METRIC RANK
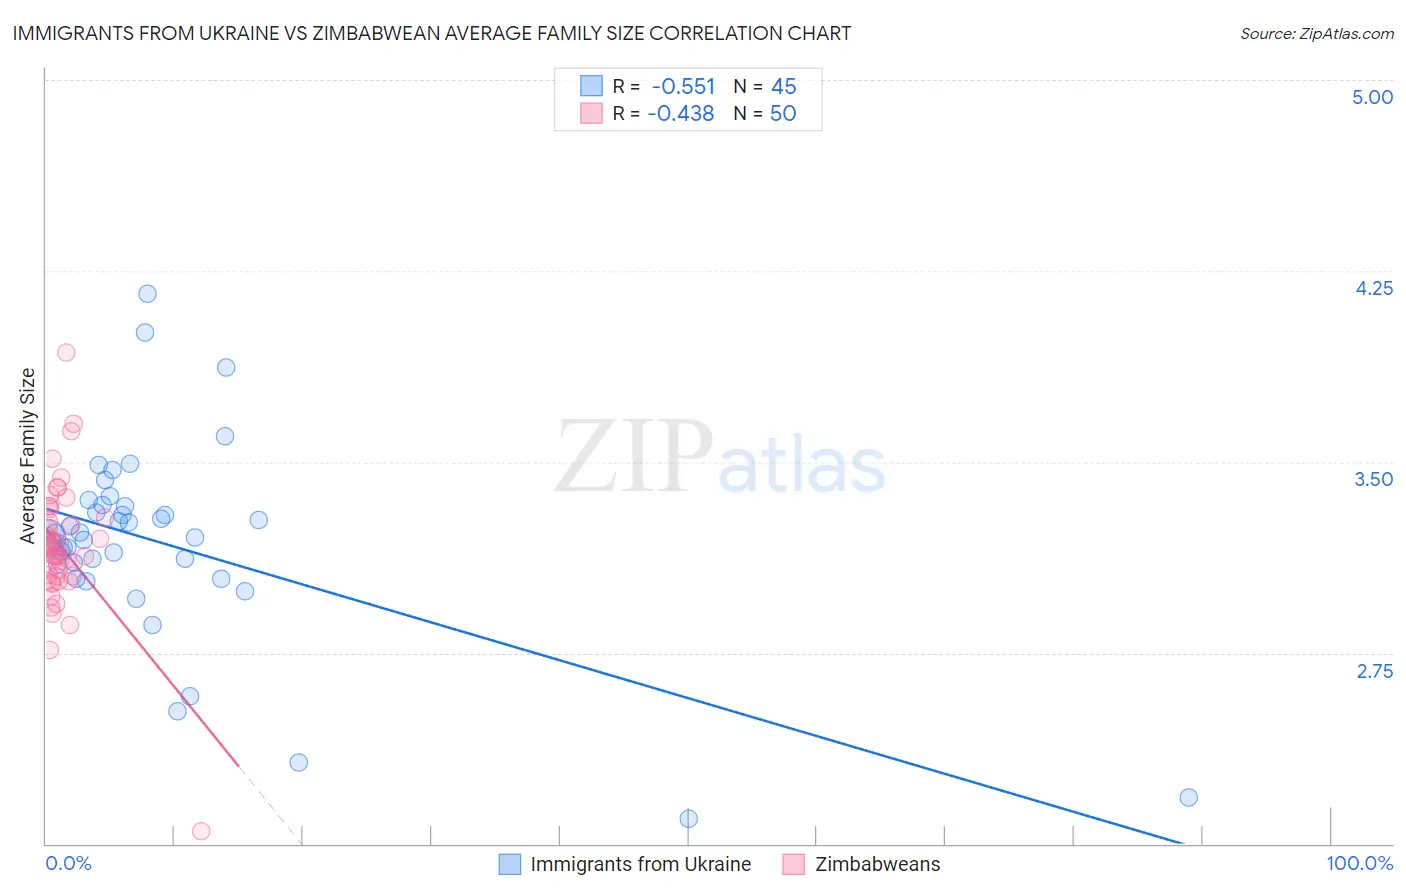
Immigrants from Ukraine vs Zimbabwean Average Family Size Correlation Chart
The statistical analysis conducted on geographies consisting of 289,649,929 people shows a substantial negative correlation between the proportion of Immigrants from Ukraine and average family size in the United States with a correlation coefficient (R) of -0.551 and weighted average of 3.19. Similarly, the statistical analysis conducted on geographies consisting of 69,189,771 people shows a moderate negative correlation between the proportion of Zimbabweans and average family size in the United States with a correlation coefficient (R) of -0.438 and weighted average of 3.20, a difference of 0.29%.
Average Family Size Correlation Summary
| Measurement | Immigrants from Ukraine | Zimbabwean |
| Minimum | 2.10 | 2.05 |
| Maximum | 4.16 | 3.93 |
| Range | 2.06 | 1.88 |
| Mean | 3.18 | 3.16 |
| Median | 3.20 | 3.15 |
| Interquartile 25% (IQ1) | 3.07 | 3.05 |
| Interquartile 75% (IQ3) | 3.33 | 3.28 |
| Interquartile Range (IQR) | 0.26 | 0.23 |
| Standard Deviation (Sample) | 0.39 | 0.26 |
| Standard Deviation (Population) | 0.39 | 0.26 |
Demographics Similar to Immigrants from Ukraine and Zimbabweans by Average Family Size
In terms of average family size, the demographic groups most similar to Immigrants from Ukraine are Immigrants from Kuwait (3.19, a difference of 0.0%), Immigrants from Zimbabwe (3.19, a difference of 0.010%), Syrian (3.19, a difference of 0.050%), Cree (3.19, a difference of 0.070%), and Lebanese (3.19, a difference of 0.12%). Similarly, the demographic groups most similar to Zimbabweans are Immigrants from Iran (3.20, a difference of 0.020%), Creek (3.20, a difference of 0.020%), Chippewa (3.20, a difference of 0.030%), Sudanese (3.20, a difference of 0.030%), and Filipino (3.20, a difference of 0.040%).
| Demographics | Rating | Rank | Average Family Size |
| Paraguayans | 16.3 /100 | #205 | Poor 3.20 |
| Immigrants | Cabo Verde | 16.0 /100 | #206 | Poor 3.20 |
| Filipinos | 13.6 /100 | #207 | Poor 3.20 |
| Chippewa | 13.3 /100 | #208 | Poor 3.20 |
| Sudanese | 13.3 /100 | #209 | Poor 3.20 |
| Zimbabweans | 12.6 /100 | #210 | Poor 3.20 |
| Immigrants | Iran | 12.1 /100 | #211 | Poor 3.20 |
| Creek | 12.1 /100 | #212 | Poor 3.20 |
| Mongolians | 11.5 /100 | #213 | Poor 3.20 |
| Somalis | 11.2 /100 | #214 | Poor 3.20 |
| Delaware | 11.1 /100 | #215 | Poor 3.20 |
| Bermudans | 11.0 /100 | #216 | Poor 3.20 |
| Immigrants | Somalia | 10.3 /100 | #217 | Poor 3.20 |
| French American Indians | 9.8 /100 | #218 | Tragic 3.20 |
| Pennsylvania Germans | 9.3 /100 | #219 | Tragic 3.19 |
| Lebanese | 9.1 /100 | #220 | Tragic 3.19 |
| Immigrants | Ukraine | 7.2 /100 | #221 | Tragic 3.19 |
| Immigrants | Kuwait | 7.2 /100 | #222 | Tragic 3.19 |
| Immigrants | Zimbabwe | 7.1 /100 | #223 | Tragic 3.19 |
| Syrians | 6.5 /100 | #224 | Tragic 3.19 |
| Cree | 6.2 /100 | #225 | Tragic 3.19 |