Immigrants from Western Asia vs Polish Married-couple Households
COMPARE
Immigrants from Western Asia
Polish
Married-couple Households
Married-couple Households Comparison
Immigrants from Western Asia
Poles
46.9%
MARRIED-COUPLE HOUSEHOLDS
76.1/ 100
METRIC RATING
154th/ 347
METRIC RANK
48.5%
MARRIED-COUPLE HOUSEHOLDS
99.2/ 100
METRIC RATING
57th/ 347
METRIC RANK
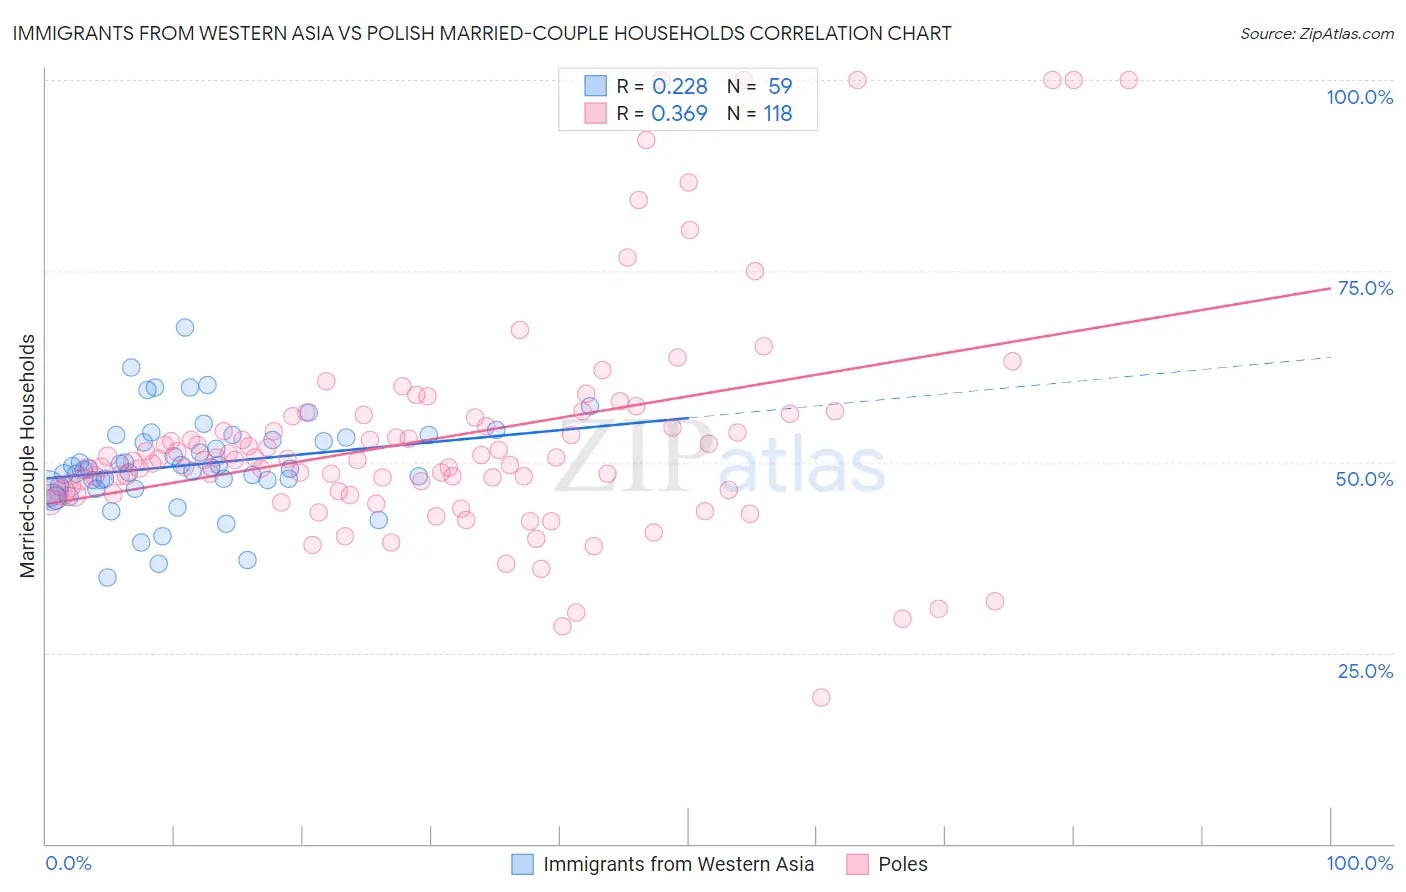
Immigrants from Western Asia vs Polish Married-couple Households Correlation Chart
The statistical analysis conducted on geographies consisting of 404,157,089 people shows a weak positive correlation between the proportion of Immigrants from Western Asia and percentage of married-couple family households in the United States with a correlation coefficient (R) of 0.228 and weighted average of 46.9%. Similarly, the statistical analysis conducted on geographies consisting of 559,940,539 people shows a mild positive correlation between the proportion of Poles and percentage of married-couple family households in the United States with a correlation coefficient (R) of 0.369 and weighted average of 48.5%, a difference of 3.4%.
Married-couple Households Correlation Summary
| Measurement | Immigrants from Western Asia | Polish |
| Minimum | 34.9% | 19.1% |
| Maximum | 67.5% | 100.0% |
| Range | 32.6% | 80.9% |
| Mean | 49.6% | 53.2% |
| Median | 49.1% | 50.3% |
| Interquartile 25% (IQ1) | 46.6% | 46.2% |
| Interquartile 75% (IQ3) | 53.1% | 56.0% |
| Interquartile Range (IQR) | 6.6% | 9.8% |
| Standard Deviation (Sample) | 6.2% | 15.2% |
| Standard Deviation (Population) | 6.1% | 15.1% |
Similar Demographics by Married-couple Households
Demographics Similar to Immigrants from Western Asia by Married-couple Households
In terms of married-couple households, the demographic groups most similar to Immigrants from Western Asia are Hmong (47.0%, a difference of 0.0%), Serbian (47.0%, a difference of 0.010%), Arab (46.9%, a difference of 0.010%), Immigrants from Bulgaria (47.0%, a difference of 0.040%), and Armenian (46.9%, a difference of 0.040%).
| Demographics | Rating | Rank | Married-couple Households |
| Immigrants | Syria | 81.6 /100 | #147 | Excellent 47.1% |
| Icelanders | 79.5 /100 | #148 | Good 47.0% |
| Paraguayans | 78.7 /100 | #149 | Good 47.0% |
| Immigrants | Russia | 77.6 /100 | #150 | Good 47.0% |
| Immigrants | Bulgaria | 76.8 /100 | #151 | Good 47.0% |
| Serbians | 76.3 /100 | #152 | Good 47.0% |
| Hmong | 76.2 /100 | #153 | Good 47.0% |
| Immigrants | Western Asia | 76.1 /100 | #154 | Good 46.9% |
| Arabs | 76.0 /100 | #155 | Good 46.9% |
| Armenians | 75.4 /100 | #156 | Good 46.9% |
| Immigrants | Oceania | 74.8 /100 | #157 | Good 46.9% |
| Immigrants | Nonimmigrants | 73.3 /100 | #158 | Good 46.9% |
| Osage | 73.2 /100 | #159 | Good 46.9% |
| Iraqis | 71.7 /100 | #160 | Good 46.9% |
| Delaware | 71.2 /100 | #161 | Good 46.8% |
Demographics Similar to Poles by Married-couple Households
In terms of married-couple households, the demographic groups most similar to Poles are Immigrants from Indonesia (48.5%, a difference of 0.0%), Czechoslovakian (48.5%, a difference of 0.010%), Croatian (48.5%, a difference of 0.080%), Immigrants from Lithuania (48.6%, a difference of 0.090%), and Austrian (48.6%, a difference of 0.090%).
| Demographics | Rating | Rank | Married-couple Households |
| Samoans | 99.4 /100 | #50 | Exceptional 48.7% |
| Eastern Europeans | 99.3 /100 | #51 | Exceptional 48.6% |
| Irish | 99.3 /100 | #52 | Exceptional 48.6% |
| Whites/Caucasians | 99.3 /100 | #53 | Exceptional 48.6% |
| Immigrants | Lithuania | 99.3 /100 | #54 | Exceptional 48.6% |
| Austrians | 99.3 /100 | #55 | Exceptional 48.6% |
| Immigrants | Northern Europe | 99.3 /100 | #56 | Exceptional 48.6% |
| Poles | 99.2 /100 | #57 | Exceptional 48.5% |
| Immigrants | Indonesia | 99.2 /100 | #58 | Exceptional 48.5% |
| Czechoslovakians | 99.2 /100 | #59 | Exceptional 48.5% |
| Croatians | 99.1 /100 | #60 | Exceptional 48.5% |
| Bulgarians | 99.1 /100 | #61 | Exceptional 48.5% |
| Luxembourgers | 99.1 /100 | #62 | Exceptional 48.5% |
| Basques | 99.0 /100 | #63 | Exceptional 48.4% |
| Northern Europeans | 99.0 /100 | #64 | Exceptional 48.4% |