Iraqi vs Ghanaian Divorced or Separated
COMPARE
Iraqi
Ghanaian
Divorced or Separated
Divorced or Separated Comparison
Iraqis
Ghanaians
11.8%
DIVORCED OR SEPARATED
94.6/ 100
METRIC RATING
120th/ 347
METRIC RANK
12.1%
DIVORCED OR SEPARATED
45.9/ 100
METRIC RATING
178th/ 347
METRIC RANK
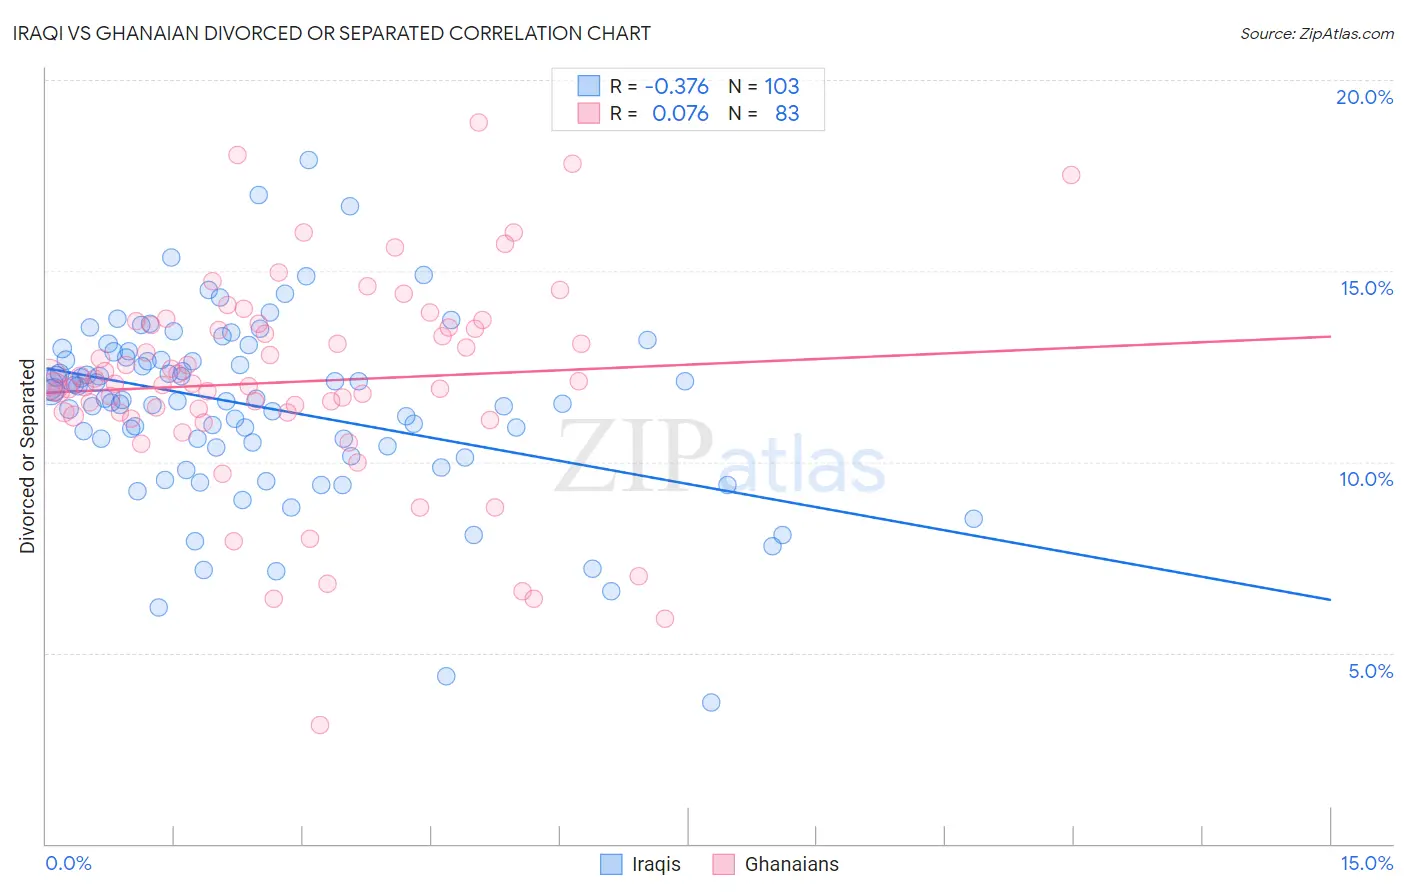
Iraqi vs Ghanaian Divorced or Separated Correlation Chart
The statistical analysis conducted on geographies consisting of 170,608,468 people shows a mild negative correlation between the proportion of Iraqis and percentage of population currently divorced or separated in the United States with a correlation coefficient (R) of -0.376 and weighted average of 11.8%. Similarly, the statistical analysis conducted on geographies consisting of 190,579,884 people shows a slight positive correlation between the proportion of Ghanaians and percentage of population currently divorced or separated in the United States with a correlation coefficient (R) of 0.076 and weighted average of 12.1%, a difference of 2.7%.
Divorced or Separated Correlation Summary
| Measurement | Iraqi | Ghanaian |
| Minimum | 3.7% | 3.1% |
| Maximum | 17.9% | 18.9% |
| Range | 14.2% | 15.8% |
| Mean | 11.4% | 12.1% |
| Median | 11.7% | 12.1% |
| Interquartile 25% (IQ1) | 10.4% | 11.3% |
| Interquartile 75% (IQ3) | 12.7% | 13.6% |
| Interquartile Range (IQR) | 2.4% | 2.3% |
| Standard Deviation (Sample) | 2.4% | 2.7% |
| Standard Deviation (Population) | 2.4% | 2.7% |
Similar Demographics by Divorced or Separated
Demographics Similar to Iraqis by Divorced or Separated
In terms of divorced or separated, the demographic groups most similar to Iraqis are Romanian (11.8%, a difference of 0.010%), Syrian (11.7%, a difference of 0.090%), Immigrants from Uganda (11.7%, a difference of 0.13%), Ecuadorian (11.7%, a difference of 0.13%), and Menominee (11.8%, a difference of 0.13%).
| Demographics | Rating | Rank | Divorced or Separated |
| Estonians | 96.6 /100 | #113 | Exceptional 11.7% |
| Immigrants | Norway | 95.9 /100 | #114 | Exceptional 11.7% |
| Lithuanians | 95.7 /100 | #115 | Exceptional 11.7% |
| Immigrants | Iraq | 95.4 /100 | #116 | Exceptional 11.7% |
| Immigrants | Uganda | 95.3 /100 | #117 | Exceptional 11.7% |
| Ecuadorians | 95.3 /100 | #118 | Exceptional 11.7% |
| Syrians | 95.1 /100 | #119 | Exceptional 11.7% |
| Iraqis | 94.6 /100 | #120 | Exceptional 11.8% |
| Romanians | 94.5 /100 | #121 | Exceptional 11.8% |
| Menominee | 93.8 /100 | #122 | Exceptional 11.8% |
| Immigrants | Immigrants | 93.7 /100 | #123 | Exceptional 11.8% |
| Ugandans | 93.1 /100 | #124 | Exceptional 11.8% |
| Ukrainians | 92.3 /100 | #125 | Exceptional 11.8% |
| South American Indians | 92.1 /100 | #126 | Exceptional 11.8% |
| South Africans | 88.9 /100 | #127 | Excellent 11.8% |
Demographics Similar to Ghanaians by Divorced or Separated
In terms of divorced or separated, the demographic groups most similar to Ghanaians are Immigrants from Western Europe (12.1%, a difference of 0.010%), Barbadian (12.1%, a difference of 0.030%), Brazilian (12.1%, a difference of 0.060%), Immigrants from Canada (12.1%, a difference of 0.060%), and Immigrants from Ethiopia (12.1%, a difference of 0.10%).
| Demographics | Rating | Rank | Divorced or Separated |
| Costa Ricans | 53.3 /100 | #171 | Average 12.0% |
| Immigrants | Mexico | 53.2 /100 | #172 | Average 12.0% |
| Immigrants | Moldova | 50.4 /100 | #173 | Average 12.1% |
| Hawaiians | 50.0 /100 | #174 | Average 12.1% |
| Immigrants | Sierra Leone | 50.0 /100 | #175 | Average 12.1% |
| Pennsylvania Germans | 48.9 /100 | #176 | Average 12.1% |
| Brazilians | 47.7 /100 | #177 | Average 12.1% |
| Ghanaians | 45.9 /100 | #178 | Average 12.1% |
| Immigrants | Western Europe | 45.6 /100 | #179 | Average 12.1% |
| Barbadians | 45.0 /100 | #180 | Average 12.1% |
| Immigrants | Canada | 44.0 /100 | #181 | Average 12.1% |
| Immigrants | Ethiopia | 43.1 /100 | #182 | Average 12.1% |
| Immigrants | Central America | 42.9 /100 | #183 | Average 12.1% |
| Immigrants | North America | 41.1 /100 | #184 | Average 12.1% |
| Immigrants | Nigeria | 40.5 /100 | #185 | Average 12.1% |