Israeli vs French American Indian Family Households
COMPARE
Israeli
French American Indian
Family Households
Family Households Comparison
Israelis
French American Indians
63.1%
FAMILY HOUSEHOLDS
0.4/ 100
METRIC RATING
267th/ 347
METRIC RANK
62.4%
FAMILY HOUSEHOLDS
0.0/ 100
METRIC RATING
297th/ 347
METRIC RANK
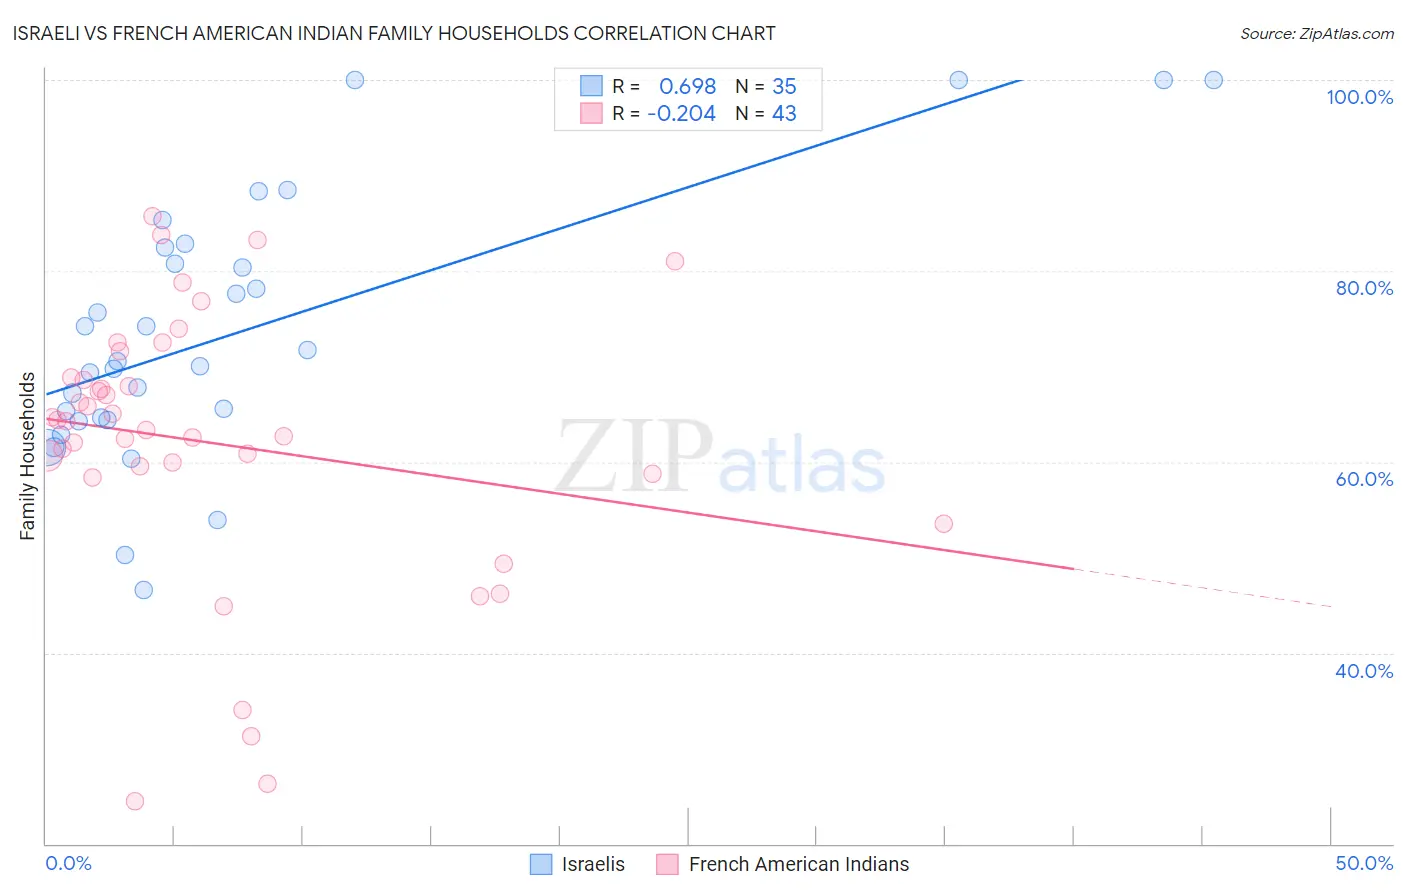
Israeli vs French American Indian Family Households Correlation Chart
The statistical analysis conducted on geographies consisting of 210,999,520 people shows a significant positive correlation between the proportion of Israelis and percentage of family households in the United States with a correlation coefficient (R) of 0.698 and weighted average of 63.1%. Similarly, the statistical analysis conducted on geographies consisting of 131,961,185 people shows a weak negative correlation between the proportion of French American Indians and percentage of family households in the United States with a correlation coefficient (R) of -0.204 and weighted average of 62.4%, a difference of 1.1%.
Family Households Correlation Summary
| Measurement | Israeli | French American Indian |
| Minimum | 46.6% | 24.4% |
| Maximum | 100.0% | 85.7% |
| Range | 53.4% | 61.3% |
| Mean | 73.6% | 62.0% |
| Median | 70.5% | 64.2% |
| Interquartile 25% (IQ1) | 64.4% | 58.8% |
| Interquartile 75% (IQ3) | 82.5% | 68.8% |
| Interquartile Range (IQR) | 18.1% | 10.1% |
| Standard Deviation (Sample) | 13.8% | 14.3% |
| Standard Deviation (Population) | 13.6% | 14.1% |
Similar Demographics by Family Households
Demographics Similar to Israelis by Family Households
In terms of family households, the demographic groups most similar to Israelis are Immigrants from Western Africa (63.1%, a difference of 0.040%), Colville (63.2%, a difference of 0.050%), Immigrants from Singapore (63.1%, a difference of 0.050%), Cheyenne (63.2%, a difference of 0.060%), and Kenyan (63.2%, a difference of 0.060%).
| Demographics | Rating | Rank | Family Households |
| Cypriots | 0.6 /100 | #260 | Tragic 63.2% |
| Immigrants | Russia | 0.6 /100 | #261 | Tragic 63.2% |
| Immigrants | Ireland | 0.6 /100 | #262 | Tragic 63.2% |
| Cheyenne | 0.5 /100 | #263 | Tragic 63.2% |
| Kenyans | 0.5 /100 | #264 | Tragic 63.2% |
| Colville | 0.5 /100 | #265 | Tragic 63.2% |
| Immigrants | Western Africa | 0.5 /100 | #266 | Tragic 63.1% |
| Israelis | 0.4 /100 | #267 | Tragic 63.1% |
| Immigrants | Singapore | 0.4 /100 | #268 | Tragic 63.1% |
| Yugoslavians | 0.4 /100 | #269 | Tragic 63.1% |
| Immigrants | Austria | 0.3 /100 | #270 | Tragic 63.1% |
| Immigrants | Croatia | 0.3 /100 | #271 | Tragic 63.1% |
| Immigrants | Turkey | 0.3 /100 | #272 | Tragic 63.1% |
| Immigrants | Kazakhstan | 0.3 /100 | #273 | Tragic 63.1% |
| Lumbee | 0.3 /100 | #274 | Tragic 63.1% |
Demographics Similar to French American Indians by Family Households
In terms of family households, the demographic groups most similar to French American Indians are Slovene (62.4%, a difference of 0.010%), Okinawan (62.5%, a difference of 0.020%), Immigrants from Spain (62.4%, a difference of 0.030%), Barbadian (62.5%, a difference of 0.040%), and Immigrants from Kuwait (62.4%, a difference of 0.090%).
| Demographics | Rating | Rank | Family Households |
| Immigrants | Grenada | 0.0 /100 | #290 | Tragic 62.6% |
| U.S. Virgin Islanders | 0.0 /100 | #291 | Tragic 62.6% |
| Immigrants | Burma/Myanmar | 0.0 /100 | #292 | Tragic 62.6% |
| Immigrants | Sweden | 0.0 /100 | #293 | Tragic 62.5% |
| Barbadians | 0.0 /100 | #294 | Tragic 62.5% |
| Okinawans | 0.0 /100 | #295 | Tragic 62.5% |
| Slovenes | 0.0 /100 | #296 | Tragic 62.4% |
| French American Indians | 0.0 /100 | #297 | Tragic 62.4% |
| Immigrants | Spain | 0.0 /100 | #298 | Tragic 62.4% |
| Immigrants | Kuwait | 0.0 /100 | #299 | Tragic 62.4% |
| Immigrants | Africa | 0.0 /100 | #300 | Tragic 62.4% |
| Immigrants | Albania | 0.0 /100 | #301 | Tragic 62.4% |
| Immigrants | Kenya | 0.0 /100 | #302 | Tragic 62.3% |
| Cree | 0.0 /100 | #303 | Tragic 62.3% |
| Iroquois | 0.0 /100 | #304 | Tragic 62.2% |