Italian vs Cajun Currently Married
COMPARE
Italian
Cajun
Currently Married
Currently Married Comparison
Italians
Cajuns
48.8%
CURRENTLY MARRIED
99.4/ 100
METRIC RATING
36th/ 347
METRIC RANK
47.1%
CURRENTLY MARRIED
75.3/ 100
METRIC RATING
140th/ 347
METRIC RANK
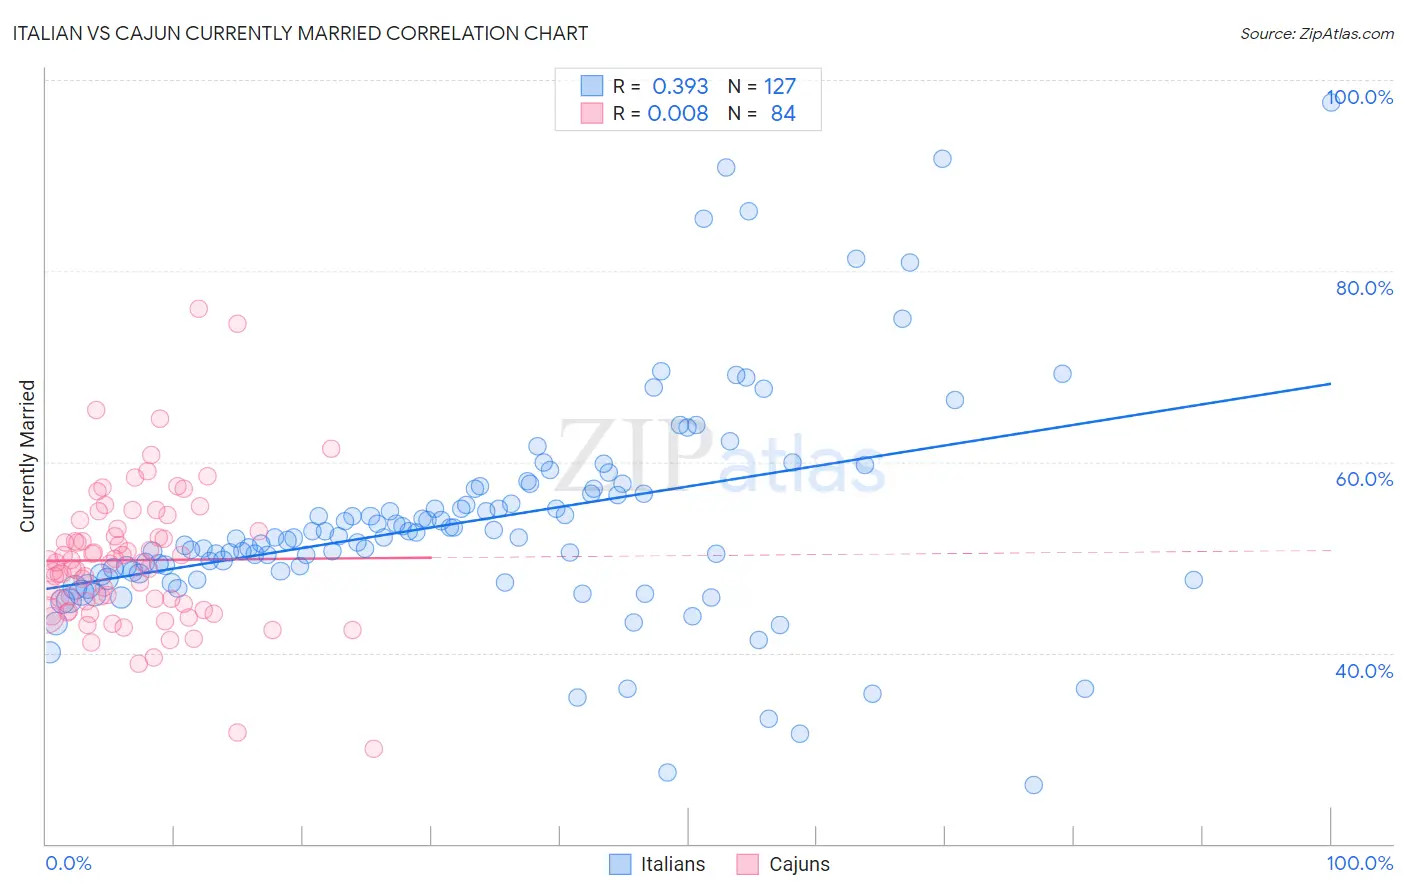
Italian vs Cajun Currently Married Correlation Chart
The statistical analysis conducted on geographies consisting of 574,980,657 people shows a mild positive correlation between the proportion of Italians and percentage of population currently married in the United States with a correlation coefficient (R) of 0.393 and weighted average of 48.8%. Similarly, the statistical analysis conducted on geographies consisting of 149,704,790 people shows no correlation between the proportion of Cajuns and percentage of population currently married in the United States with a correlation coefficient (R) of 0.008 and weighted average of 47.1%, a difference of 3.6%.
Currently Married Correlation Summary
| Measurement | Italian | Cajun |
| Minimum | 26.2% | 29.9% |
| Maximum | 97.6% | 76.1% |
| Range | 71.5% | 46.2% |
| Mean | 53.8% | 49.7% |
| Median | 52.1% | 49.4% |
| Interquartile 25% (IQ1) | 48.3% | 44.9% |
| Interquartile 75% (IQ3) | 57.2% | 52.9% |
| Interquartile Range (IQR) | 8.8% | 8.0% |
| Standard Deviation (Sample) | 11.5% | 7.5% |
| Standard Deviation (Population) | 11.5% | 7.4% |
Similar Demographics by Currently Married
Demographics Similar to Italians by Currently Married
In terms of currently married, the demographic groups most similar to Italians are Hungarian (48.8%, a difference of 0.0%), Immigrants from Northern Europe (48.8%, a difference of 0.010%), Immigrants from Lithuania (48.8%, a difference of 0.030%), Czechoslovakian (48.8%, a difference of 0.040%), and British (48.8%, a difference of 0.070%).
| Demographics | Rating | Rank | Currently Married |
| Croatians | 99.5 /100 | #29 | Exceptional 48.9% |
| Eastern Europeans | 99.5 /100 | #30 | Exceptional 48.9% |
| Poles | 99.5 /100 | #31 | Exceptional 48.9% |
| Immigrants | Hong Kong | 99.5 /100 | #32 | Exceptional 48.9% |
| Irish | 99.5 /100 | #33 | Exceptional 48.9% |
| Immigrants | Lithuania | 99.4 /100 | #34 | Exceptional 48.8% |
| Immigrants | Northern Europe | 99.4 /100 | #35 | Exceptional 48.8% |
| Italians | 99.4 /100 | #36 | Exceptional 48.8% |
| Hungarians | 99.4 /100 | #37 | Exceptional 48.8% |
| Czechoslovakians | 99.4 /100 | #38 | Exceptional 48.8% |
| British | 99.4 /100 | #39 | Exceptional 48.8% |
| Immigrants | Canada | 99.4 /100 | #40 | Exceptional 48.8% |
| Greeks | 99.3 /100 | #41 | Exceptional 48.8% |
| Finns | 99.3 /100 | #42 | Exceptional 48.8% |
| Scotch-Irish | 99.3 /100 | #43 | Exceptional 48.7% |
Demographics Similar to Cajuns by Currently Married
In terms of currently married, the demographic groups most similar to Cajuns are Venezuelan (47.1%, a difference of 0.040%), Argentinean (47.1%, a difference of 0.040%), Guamanian/Chamorro (47.1%, a difference of 0.050%), Hmong (47.1%, a difference of 0.090%), and Pakistani (47.2%, a difference of 0.11%).
| Demographics | Rating | Rank | Currently Married |
| Immigrants | Malaysia | 81.1 /100 | #133 | Excellent 47.3% |
| Immigrants | Australia | 81.1 /100 | #134 | Excellent 47.3% |
| Immigrants | Norway | 79.7 /100 | #135 | Good 47.2% |
| Immigrants | Vietnam | 78.2 /100 | #136 | Good 47.2% |
| Paraguayans | 77.8 /100 | #137 | Good 47.2% |
| Pakistanis | 77.5 /100 | #138 | Good 47.2% |
| Yugoslavians | 77.4 /100 | #139 | Good 47.2% |
| Cajuns | 75.3 /100 | #140 | Good 47.1% |
| Venezuelans | 74.4 /100 | #141 | Good 47.1% |
| Argentineans | 74.4 /100 | #142 | Good 47.1% |
| Guamanians/Chamorros | 74.2 /100 | #143 | Good 47.1% |
| Hmong | 73.4 /100 | #144 | Good 47.1% |
| Immigrants | South Eastern Asia | 72.9 /100 | #145 | Good 47.1% |
| Carpatho Rusyns | 72.6 /100 | #146 | Good 47.0% |
| Immigrants | Argentina | 72.0 /100 | #147 | Good 47.0% |