Kiowa vs Hungarian Family Households
COMPARE
Kiowa
Hungarian
Family Households
Family Households Comparison
Kiowa
Hungarians
61.4%
FAMILY HOUSEHOLDS
0.0/ 100
METRIC RATING
328th/ 347
METRIC RANK
64.9%
FAMILY HOUSEHOLDS
94.0/ 100
METRIC RATING
121st/ 347
METRIC RANK
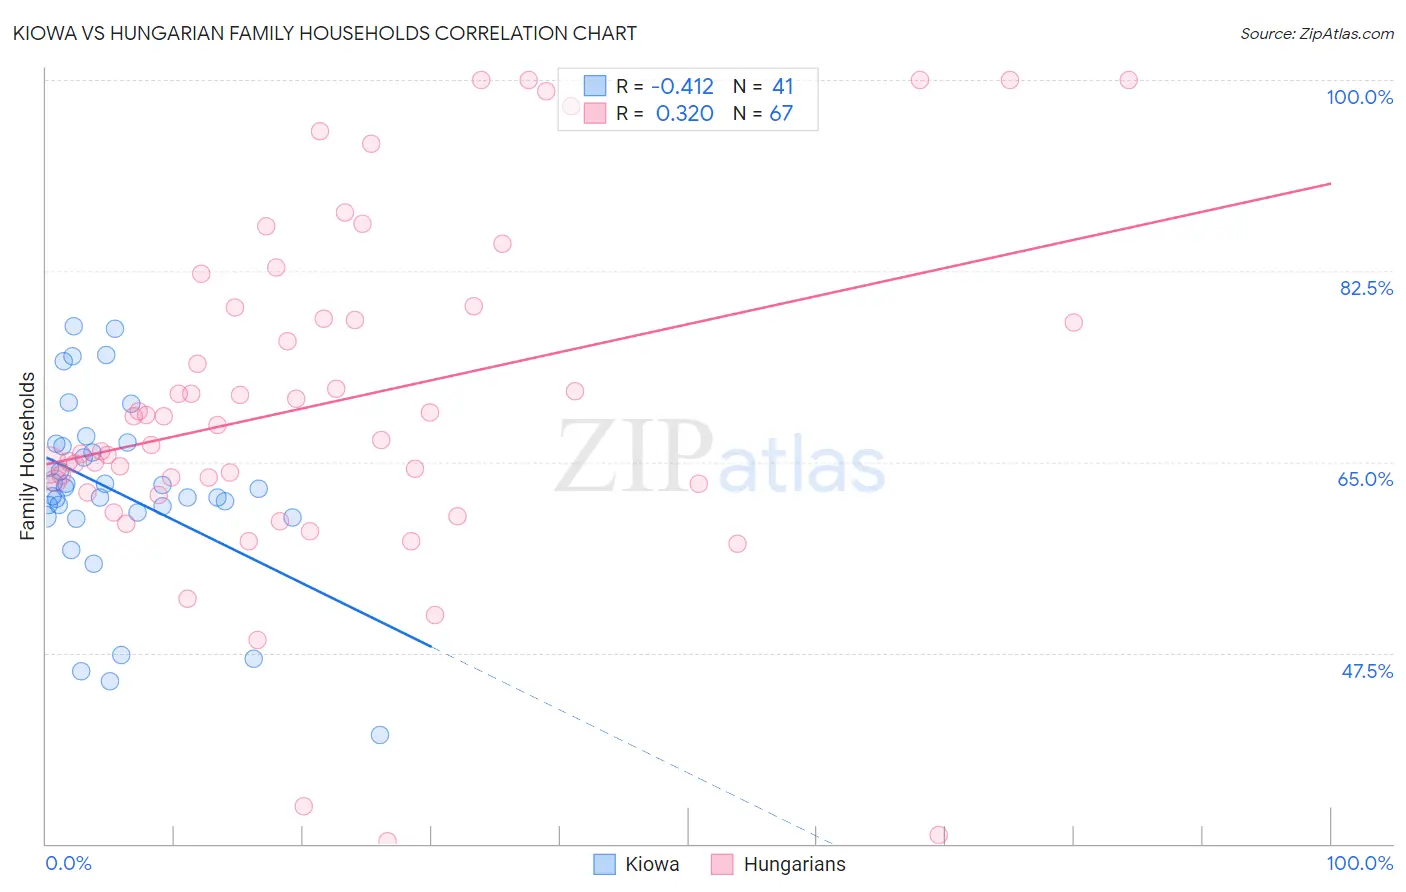
Kiowa vs Hungarian Family Households Correlation Chart
The statistical analysis conducted on geographies consisting of 56,099,396 people shows a moderate negative correlation between the proportion of Kiowa and percentage of family households in the United States with a correlation coefficient (R) of -0.412 and weighted average of 61.4%. Similarly, the statistical analysis conducted on geographies consisting of 485,906,921 people shows a mild positive correlation between the proportion of Hungarians and percentage of family households in the United States with a correlation coefficient (R) of 0.320 and weighted average of 64.9%, a difference of 5.7%.
Family Households Correlation Summary
| Measurement | Kiowa | Hungarian |
| Minimum | 40.0% | 30.2% |
| Maximum | 77.4% | 100.0% |
| Range | 37.4% | 69.8% |
| Mean | 62.3% | 70.5% |
| Median | 62.6% | 68.4% |
| Interquartile 25% (IQ1) | 60.1% | 63.0% |
| Interquartile 75% (IQ3) | 66.6% | 79.1% |
| Interquartile Range (IQR) | 6.4% | 16.1% |
| Standard Deviation (Sample) | 8.3% | 15.7% |
| Standard Deviation (Population) | 8.2% | 15.6% |
Similar Demographics by Family Households
Demographics Similar to Kiowa by Family Households
In terms of family households, the demographic groups most similar to Kiowa are Cambodian (61.4%, a difference of 0.030%), Black/African American (61.5%, a difference of 0.13%), Indonesian (61.5%, a difference of 0.15%), Immigrants from Australia (61.3%, a difference of 0.16%), and Immigrants from France (61.3%, a difference of 0.16%).
| Demographics | Rating | Rank | Family Households |
| Alsatians | 0.0 /100 | #321 | Tragic 61.7% |
| Immigrants | Serbia | 0.0 /100 | #322 | Tragic 61.6% |
| Tlingit-Haida | 0.0 /100 | #323 | Tragic 61.6% |
| Immigrants | West Indies | 0.0 /100 | #324 | Tragic 61.6% |
| Immigrants | Switzerland | 0.0 /100 | #325 | Tragic 61.6% |
| Indonesians | 0.0 /100 | #326 | Tragic 61.5% |
| Blacks/African Americans | 0.0 /100 | #327 | Tragic 61.5% |
| Kiowa | 0.0 /100 | #328 | Tragic 61.4% |
| Cambodians | 0.0 /100 | #329 | Tragic 61.4% |
| Immigrants | Australia | 0.0 /100 | #330 | Tragic 61.3% |
| Immigrants | France | 0.0 /100 | #331 | Tragic 61.3% |
| Ethiopians | 0.0 /100 | #332 | Tragic 61.2% |
| Immigrants | Ethiopia | 0.0 /100 | #333 | Tragic 61.2% |
| Immigrants | Eastern Africa | 0.0 /100 | #334 | Tragic 61.1% |
| Carpatho Rusyns | 0.0 /100 | #335 | Tragic 61.1% |
Demographics Similar to Hungarians by Family Households
In terms of family households, the demographic groups most similar to Hungarians are Immigrants from Oceania (64.9%, a difference of 0.010%), Immigrants from Eastern Asia (64.9%, a difference of 0.020%), Hmong (64.9%, a difference of 0.040%), Choctaw (64.9%, a difference of 0.040%), and Immigrants from Argentina (64.9%, a difference of 0.060%).
| Demographics | Rating | Rank | Family Households |
| Argentineans | 95.7 /100 | #114 | Exceptional 65.0% |
| Ecuadorians | 95.4 /100 | #115 | Exceptional 65.0% |
| Immigrants | Iraq | 95.4 /100 | #116 | Exceptional 65.0% |
| Cherokee | 95.3 /100 | #117 | Exceptional 65.0% |
| Dutch | 95.1 /100 | #118 | Exceptional 64.9% |
| Immigrants | Eastern Asia | 94.4 /100 | #119 | Exceptional 64.9% |
| Immigrants | Oceania | 94.2 /100 | #120 | Exceptional 64.9% |
| Hungarians | 94.0 /100 | #121 | Exceptional 64.9% |
| Hmong | 93.4 /100 | #122 | Exceptional 64.9% |
| Choctaw | 93.4 /100 | #123 | Exceptional 64.9% |
| Immigrants | Argentina | 92.8 /100 | #124 | Exceptional 64.9% |
| Immigrants | Belize | 92.7 /100 | #125 | Exceptional 64.9% |
| Panamanians | 92.4 /100 | #126 | Exceptional 64.8% |
| Immigrants | Panama | 92.0 /100 | #127 | Exceptional 64.8% |
| Italians | 91.9 /100 | #128 | Exceptional 64.8% |