Kiowa vs Polish Births to Unmarried Women
COMPARE
Kiowa
Polish
Births to Unmarried Women
Births to Unmarried Women Comparison
Kiowa
Poles
43.1%
BIRTHS TO UNMARRIED WOMEN
0.0/ 100
METRIC RATING
332nd/ 347
METRIC RANK
30.8%
BIRTHS TO UNMARRIED WOMEN
76.2/ 100
METRIC RATING
152nd/ 347
METRIC RANK
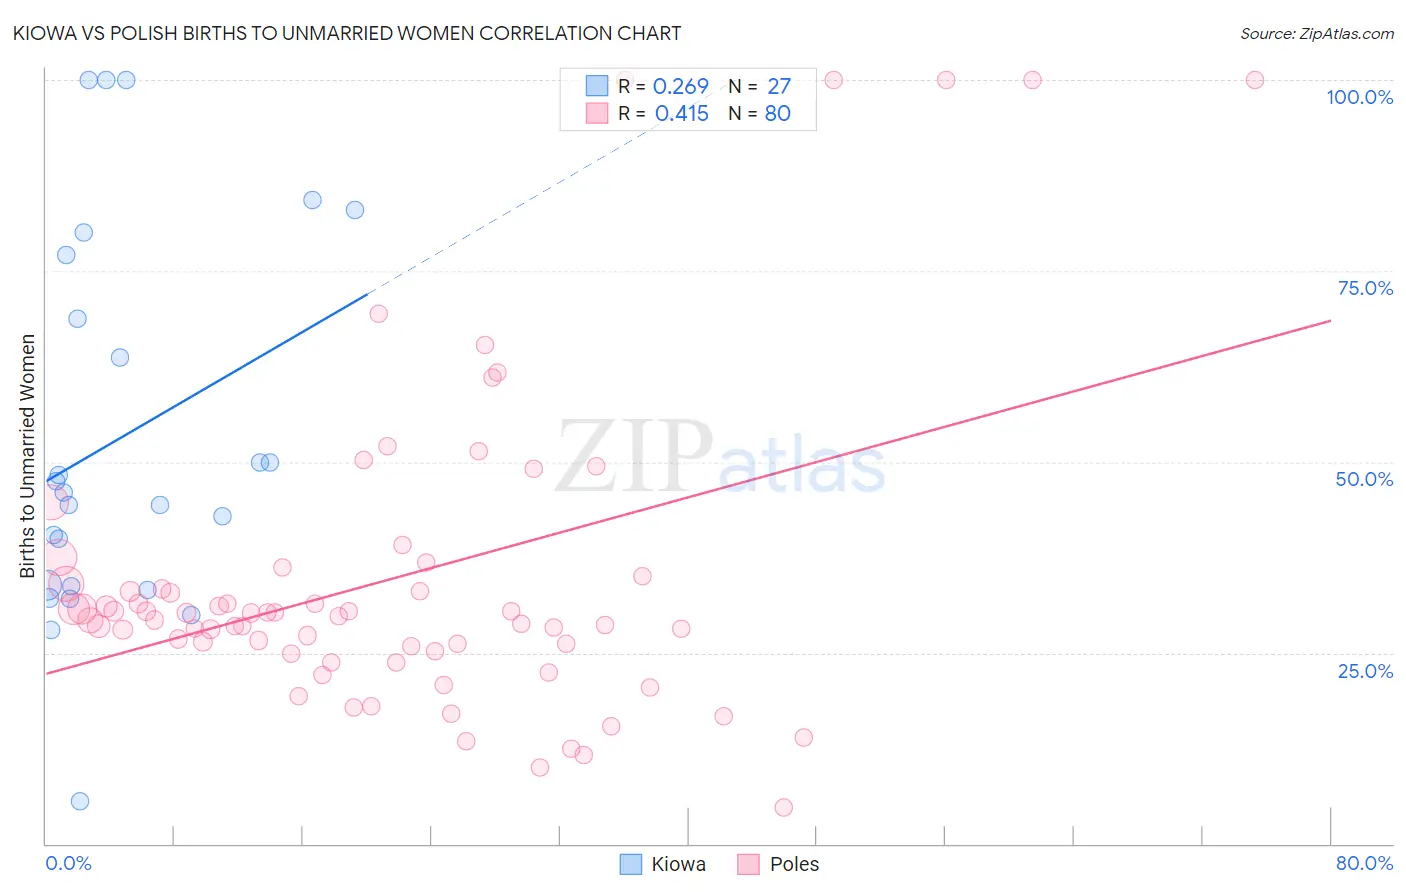
Kiowa vs Polish Births to Unmarried Women Correlation Chart
The statistical analysis conducted on geographies consisting of 55,598,383 people shows a weak positive correlation between the proportion of Kiowa and percentage of births to unmarried women in the United States with a correlation coefficient (R) of 0.269 and weighted average of 43.1%. Similarly, the statistical analysis conducted on geographies consisting of 497,645,952 people shows a moderate positive correlation between the proportion of Poles and percentage of births to unmarried women in the United States with a correlation coefficient (R) of 0.415 and weighted average of 30.8%, a difference of 40.0%.
Births to Unmarried Women Correlation Summary
| Measurement | Kiowa | Polish |
| Minimum | 5.6% | 4.8% |
| Maximum | 100.0% | 100.0% |
| Range | 94.4% | 95.2% |
| Mean | 53.3% | 34.7% |
| Median | 46.0% | 30.0% |
| Interquartile 25% (IQ1) | 33.8% | 25.6% |
| Interquartile 75% (IQ3) | 77.0% | 34.5% |
| Interquartile Range (IQR) | 43.2% | 9.0% |
| Standard Deviation (Sample) | 25.0% | 20.7% |
| Standard Deviation (Population) | 24.5% | 20.6% |
Similar Demographics by Births to Unmarried Women
Demographics Similar to Kiowa by Births to Unmarried Women
In terms of births to unmarried women, the demographic groups most similar to Kiowa are Native/Alaskan (43.0%, a difference of 0.35%), Chippewa (42.6%, a difference of 1.2%), Paiute (42.5%, a difference of 1.6%), Immigrants from Cabo Verde (42.2%, a difference of 2.2%), and Tsimshian (42.2%, a difference of 2.3%).
| Demographics | Rating | Rank | Births to Unmarried Women |
| Cheyenne | 0.0 /100 | #325 | Tragic 41.3% |
| Immigrants | Cuba | 0.0 /100 | #326 | Tragic 41.5% |
| Tsimshian | 0.0 /100 | #327 | Tragic 42.2% |
| Immigrants | Cabo Verde | 0.0 /100 | #328 | Tragic 42.2% |
| Paiute | 0.0 /100 | #329 | Tragic 42.5% |
| Chippewa | 0.0 /100 | #330 | Tragic 42.6% |
| Natives/Alaskans | 0.0 /100 | #331 | Tragic 43.0% |
| Kiowa | 0.0 /100 | #332 | Tragic 43.1% |
| Blacks/African Americans | 0.0 /100 | #333 | Tragic 44.3% |
| Yuman | 0.0 /100 | #334 | Tragic 44.4% |
| Colville | 0.0 /100 | #335 | Tragic 45.3% |
| Puerto Ricans | 0.0 /100 | #336 | Tragic 45.7% |
| Houma | 0.0 /100 | #337 | Tragic 46.6% |
| Arapaho | 0.0 /100 | #338 | Tragic 47.1% |
| Lumbee | 0.0 /100 | #339 | Tragic 48.2% |
Demographics Similar to Poles by Births to Unmarried Women
In terms of births to unmarried women, the demographic groups most similar to Poles are British (30.8%, a difference of 0.020%), Italian (30.8%, a difference of 0.11%), Yugoslavian (30.8%, a difference of 0.14%), Somali (30.7%, a difference of 0.22%), and Immigrants from Bangladesh (30.9%, a difference of 0.29%).
| Demographics | Rating | Rank | Births to Unmarried Women |
| Immigrants | North America | 81.5 /100 | #145 | Excellent 30.6% |
| Northern Europeans | 81.4 /100 | #146 | Excellent 30.6% |
| Immigrants | Oceania | 81.2 /100 | #147 | Excellent 30.6% |
| Chileans | 79.1 /100 | #148 | Good 30.7% |
| Serbians | 78.8 /100 | #149 | Good 30.7% |
| Somalis | 77.8 /100 | #150 | Good 30.7% |
| Italians | 77.0 /100 | #151 | Good 30.8% |
| Poles | 76.2 /100 | #152 | Good 30.8% |
| British | 76.0 /100 | #153 | Good 30.8% |
| Yugoslavians | 75.1 /100 | #154 | Good 30.8% |
| Immigrants | Bangladesh | 73.9 /100 | #155 | Good 30.9% |
| Carpatho Rusyns | 73.5 /100 | #156 | Good 30.9% |
| Immigrants | Eastern Africa | 72.1 /100 | #157 | Good 31.0% |
| Austrians | 69.9 /100 | #158 | Good 31.0% |
| Immigrants | England | 69.4 /100 | #159 | Good 31.1% |