Menominee vs German Russian Single Father Households
COMPARE
Menominee
German Russian
Single Father Households
Single Father Households Comparison
Menominee
German Russians
4.2%
SINGLE FATHER HOUSEHOLDS
0.0/ 100
METRIC RATING
345th/ 347
METRIC RANK
2.4%
SINGLE FATHER HOUSEHOLDS
25.7/ 100
METRIC RATING
202nd/ 347
METRIC RANK
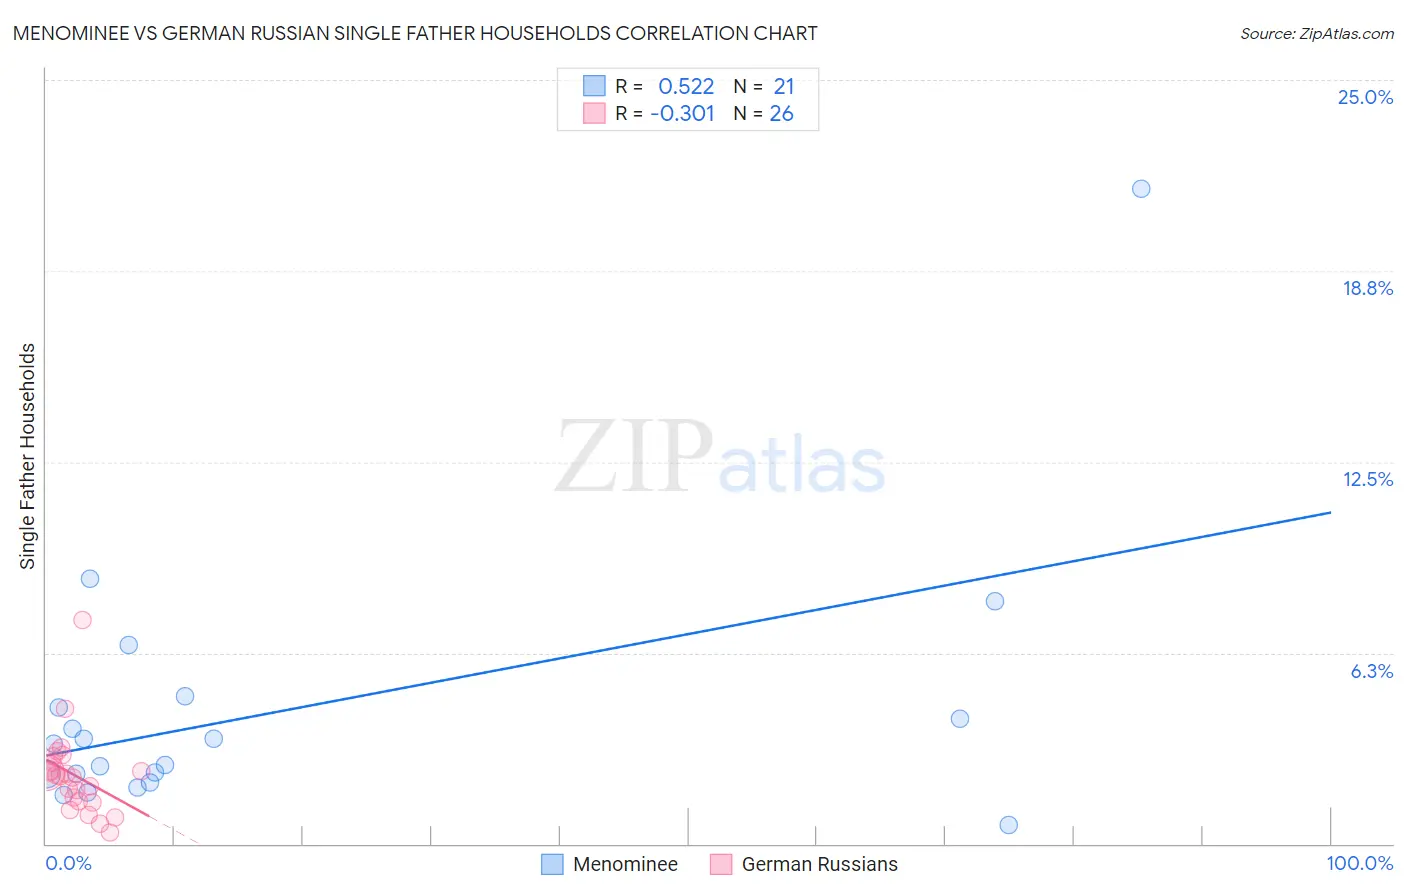
Menominee vs German Russian Single Father Households Correlation Chart
The statistical analysis conducted on geographies consisting of 45,722,024 people shows a substantial positive correlation between the proportion of Menominee and percentage of single father households in the United States with a correlation coefficient (R) of 0.522 and weighted average of 4.2%. Similarly, the statistical analysis conducted on geographies consisting of 96,318,608 people shows a mild negative correlation between the proportion of German Russians and percentage of single father households in the United States with a correlation coefficient (R) of -0.301 and weighted average of 2.4%, a difference of 76.8%.
Single Father Households Correlation Summary
| Measurement | Menominee | German Russian |
| Minimum | 0.60% | 0.38% |
| Maximum | 21.4% | 7.3% |
| Range | 20.8% | 7.0% |
| Mean | 4.4% | 2.2% |
| Median | 3.3% | 2.2% |
| Interquartile 25% (IQ1) | 2.1% | 1.4% |
| Interquartile 75% (IQ3) | 4.7% | 2.7% |
| Interquartile Range (IQR) | 2.5% | 1.3% |
| Standard Deviation (Sample) | 4.4% | 1.4% |
| Standard Deviation (Population) | 4.3% | 1.3% |
Similar Demographics by Single Father Households
Demographics Similar to Menominee by Single Father Households
In terms of single father households, the demographic groups most similar to Menominee are Yakama (4.2%, a difference of 0.69%), Pima (4.2%, a difference of 0.93%), Tohono O'odham (3.8%, a difference of 10.2%), Inupiat (4.9%, a difference of 15.3%), and Crow (3.5%, a difference of 19.9%).
| Demographics | Rating | Rank | Single Father Households |
| Natives/Alaskans | 0.0 /100 | #333 | Tragic 3.2% |
| Yuman | 0.0 /100 | #334 | Tragic 3.3% |
| Colville | 0.0 /100 | #335 | Tragic 3.3% |
| Paiute | 0.0 /100 | #336 | Tragic 3.3% |
| Pueblo | 0.0 /100 | #337 | Tragic 3.3% |
| Sioux | 0.0 /100 | #338 | Tragic 3.3% |
| Alaskan Athabascans | 0.0 /100 | #339 | Tragic 3.4% |
| Alaska Natives | 0.0 /100 | #340 | Tragic 3.5% |
| Crow | 0.0 /100 | #341 | Tragic 3.5% |
| Tohono O'odham | 0.0 /100 | #342 | Tragic 3.8% |
| Pima | 0.0 /100 | #343 | Tragic 4.2% |
| Yakama | 0.0 /100 | #344 | Tragic 4.2% |
| Menominee | 0.0 /100 | #345 | Tragic 4.2% |
| Inupiat | 0.0 /100 | #346 | Tragic 4.9% |
| Yup'ik | 0.0 /100 | #347 | Tragic 5.4% |
Demographics Similar to German Russians by Single Father Households
In terms of single father households, the demographic groups most similar to German Russians are Immigrants from Uganda (2.4%, a difference of 0.030%), French Canadian (2.4%, a difference of 0.10%), Ecuadorian (2.4%, a difference of 0.12%), Immigrants from Vietnam (2.4%, a difference of 0.13%), and Peruvian (2.4%, a difference of 0.13%).
| Demographics | Rating | Rank | Single Father Households |
| Immigrants | Philippines | 28.7 /100 | #195 | Fair 2.4% |
| Kenyans | 28.0 /100 | #196 | Fair 2.4% |
| Germans | 28.0 /100 | #197 | Fair 2.4% |
| Scandinavians | 27.4 /100 | #198 | Fair 2.4% |
| Immigrants | Vietnam | 27.1 /100 | #199 | Fair 2.4% |
| Peruvians | 27.1 /100 | #200 | Fair 2.4% |
| Immigrants | Uganda | 26.0 /100 | #201 | Fair 2.4% |
| German Russians | 25.7 /100 | #202 | Fair 2.4% |
| French Canadians | 24.7 /100 | #203 | Fair 2.4% |
| Ecuadorians | 24.5 /100 | #204 | Fair 2.4% |
| Immigrants | Afghanistan | 24.2 /100 | #205 | Fair 2.4% |
| Koreans | 24.1 /100 | #206 | Fair 2.4% |
| Whites/Caucasians | 22.6 /100 | #207 | Fair 2.4% |
| Immigrants | Kenya | 20.3 /100 | #208 | Fair 2.4% |
| Immigrants | Peru | 19.3 /100 | #209 | Poor 2.4% |