Mexican vs Immigrants from Eritrea Family Households with Children
COMPARE
Mexican
Immigrants from Eritrea
Family Households with Children
Family Households with Children Comparison
Mexicans
Immigrants from Eritrea
31.4%
FAMILY HOUSEHOLDS WITH CHILDREN
100.0/ 100
METRIC RATING
4th/ 347
METRIC RANK
27.8%
FAMILY HOUSEHOLDS WITH CHILDREN
89.4/ 100
METRIC RATING
129th/ 347
METRIC RANK
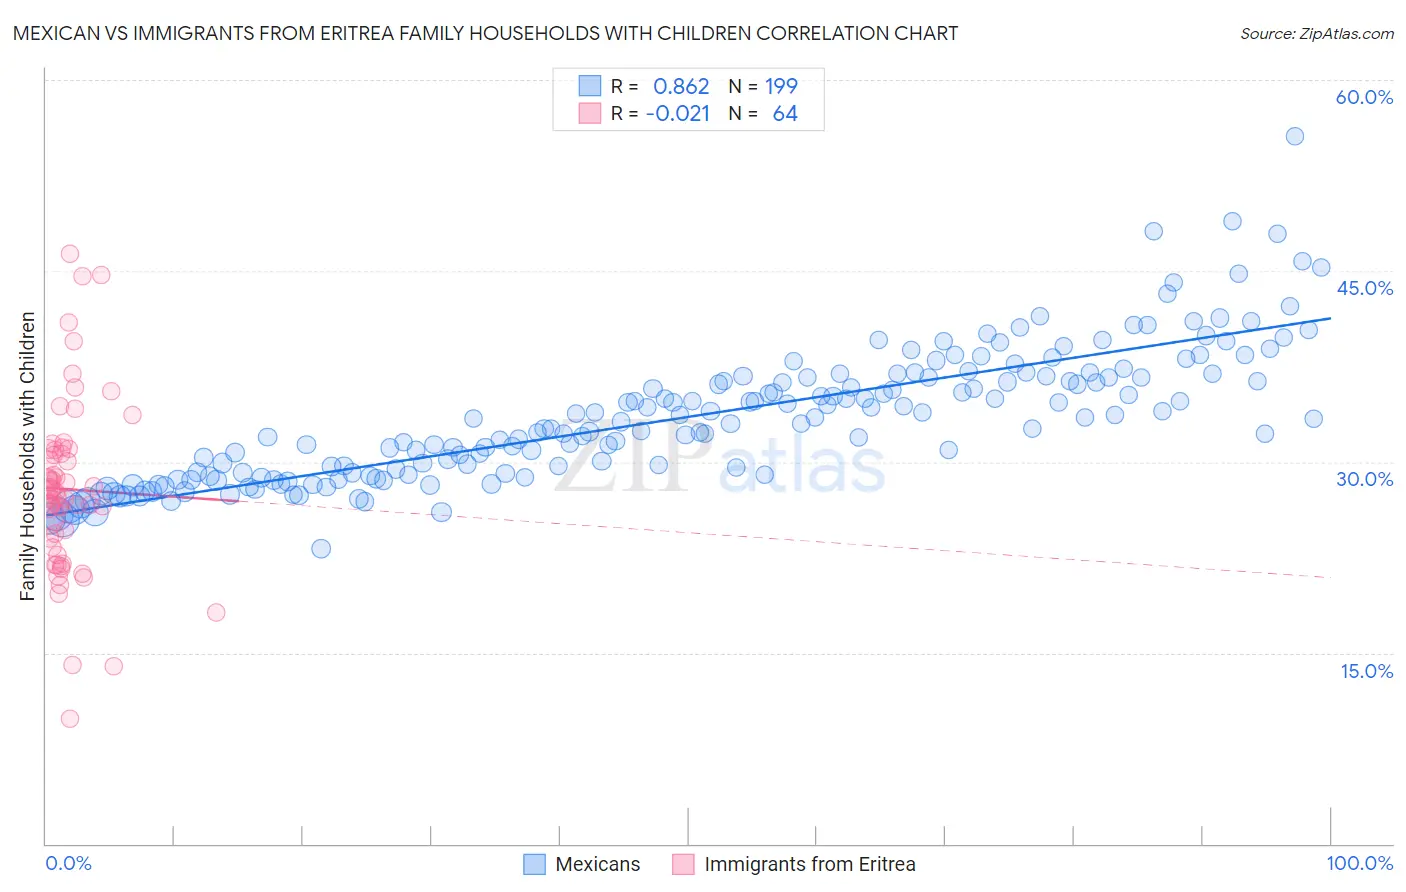
Mexican vs Immigrants from Eritrea Family Households with Children Correlation Chart
The statistical analysis conducted on geographies consisting of 564,219,663 people shows a very strong positive correlation between the proportion of Mexicans and percentage of family households with children in the United States with a correlation coefficient (R) of 0.862 and weighted average of 31.4%. Similarly, the statistical analysis conducted on geographies consisting of 104,846,826 people shows no correlation between the proportion of Immigrants from Eritrea and percentage of family households with children in the United States with a correlation coefficient (R) of -0.021 and weighted average of 27.8%, a difference of 13.0%.
Family Households with Children Correlation Summary
| Measurement | Mexican | Immigrants from Eritrea |
| Minimum | 23.2% | 9.8% |
| Maximum | 55.6% | 46.4% |
| Range | 32.5% | 36.5% |
| Mean | 33.5% | 27.9% |
| Median | 33.1% | 27.7% |
| Interquartile 25% (IQ1) | 29.1% | 23.6% |
| Interquartile 75% (IQ3) | 36.6% | 31.0% |
| Interquartile Range (IQR) | 7.6% | 7.3% |
| Standard Deviation (Sample) | 5.2% | 6.9% |
| Standard Deviation (Population) | 5.2% | 6.8% |
Similar Demographics by Family Households with Children
Demographics Similar to Mexicans by Family Households with Children
In terms of family households with children, the demographic groups most similar to Mexicans are Tongan (31.2%, a difference of 0.41%), Immigrants from Mexico (31.6%, a difference of 0.78%), Immigrants from India (31.0%, a difference of 1.0%), Immigrants from Central America (31.0%, a difference of 1.3%), and Yakama (30.8%, a difference of 1.9%).
| Demographics | Rating | Rank | Family Households with Children |
| Yup'ik | 100 /100 | #1 | Exceptional 37.0% |
| Inupiat | 100 /100 | #2 | Exceptional 32.8% |
| Immigrants | Mexico | 100.0 /100 | #3 | Exceptional 31.6% |
| Mexicans | 100.0 /100 | #4 | Exceptional 31.4% |
| Tongans | 100.0 /100 | #5 | Exceptional 31.2% |
| Immigrants | India | 100.0 /100 | #6 | Exceptional 31.0% |
| Immigrants | Central America | 100.0 /100 | #7 | Exceptional 31.0% |
| Yakama | 100.0 /100 | #8 | Exceptional 30.8% |
| Thais | 100.0 /100 | #9 | Exceptional 30.6% |
| Immigrants | Fiji | 100.0 /100 | #10 | Exceptional 30.5% |
| Nepalese | 100.0 /100 | #11 | Exceptional 30.5% |
| Immigrants | Pakistan | 100.0 /100 | #12 | Exceptional 30.2% |
| Afghans | 100.0 /100 | #13 | Exceptional 30.2% |
| Bangladeshis | 100.0 /100 | #14 | Exceptional 30.1% |
| Immigrants | South Central Asia | 100.0 /100 | #15 | Exceptional 30.0% |
Demographics Similar to Immigrants from Eritrea by Family Households with Children
In terms of family households with children, the demographic groups most similar to Immigrants from Eritrea are Syrian (27.8%, a difference of 0.020%), Belizean (27.8%, a difference of 0.040%), Immigrants from Ethiopia (27.8%, a difference of 0.070%), Immigrants from Singapore (27.8%, a difference of 0.090%), and Ecuadorian (27.8%, a difference of 0.090%).
| Demographics | Rating | Rank | Family Households with Children |
| Immigrants | Zimbabwe | 92.8 /100 | #122 | Exceptional 27.8% |
| Immigrants | Northern Africa | 91.8 /100 | #123 | Exceptional 27.8% |
| Immigrants | Singapore | 90.8 /100 | #124 | Exceptional 27.8% |
| Ecuadorians | 90.8 /100 | #125 | Exceptional 27.8% |
| Immigrants | Ethiopia | 90.5 /100 | #126 | Exceptional 27.8% |
| Belizeans | 90.0 /100 | #127 | Exceptional 27.8% |
| Syrians | 89.7 /100 | #128 | Excellent 27.8% |
| Immigrants | Eritrea | 89.4 /100 | #129 | Excellent 27.8% |
| Cajuns | 87.6 /100 | #130 | Excellent 27.7% |
| Lebanese | 87.4 /100 | #131 | Excellent 27.7% |
| Immigrants | Belize | 85.7 /100 | #132 | Excellent 27.7% |
| Iranians | 85.2 /100 | #133 | Excellent 27.7% |
| Immigrants | Panama | 84.9 /100 | #134 | Excellent 27.7% |
| Immigrants | Ecuador | 84.6 /100 | #135 | Excellent 27.7% |
| Immigrants | Portugal | 84.1 /100 | #136 | Excellent 27.7% |