Mongolian vs Nigerian Births to Unmarried Women
COMPARE
Mongolian
Nigerian
Births to Unmarried Women
Births to Unmarried Women Comparison
Mongolians
Nigerians
27.9%
BIRTHS TO UNMARRIED WOMEN
99.3/ 100
METRIC RATING
55th/ 347
METRIC RANK
35.3%
BIRTHS TO UNMARRIED WOMEN
0.7/ 100
METRIC RATING
246th/ 347
METRIC RANK
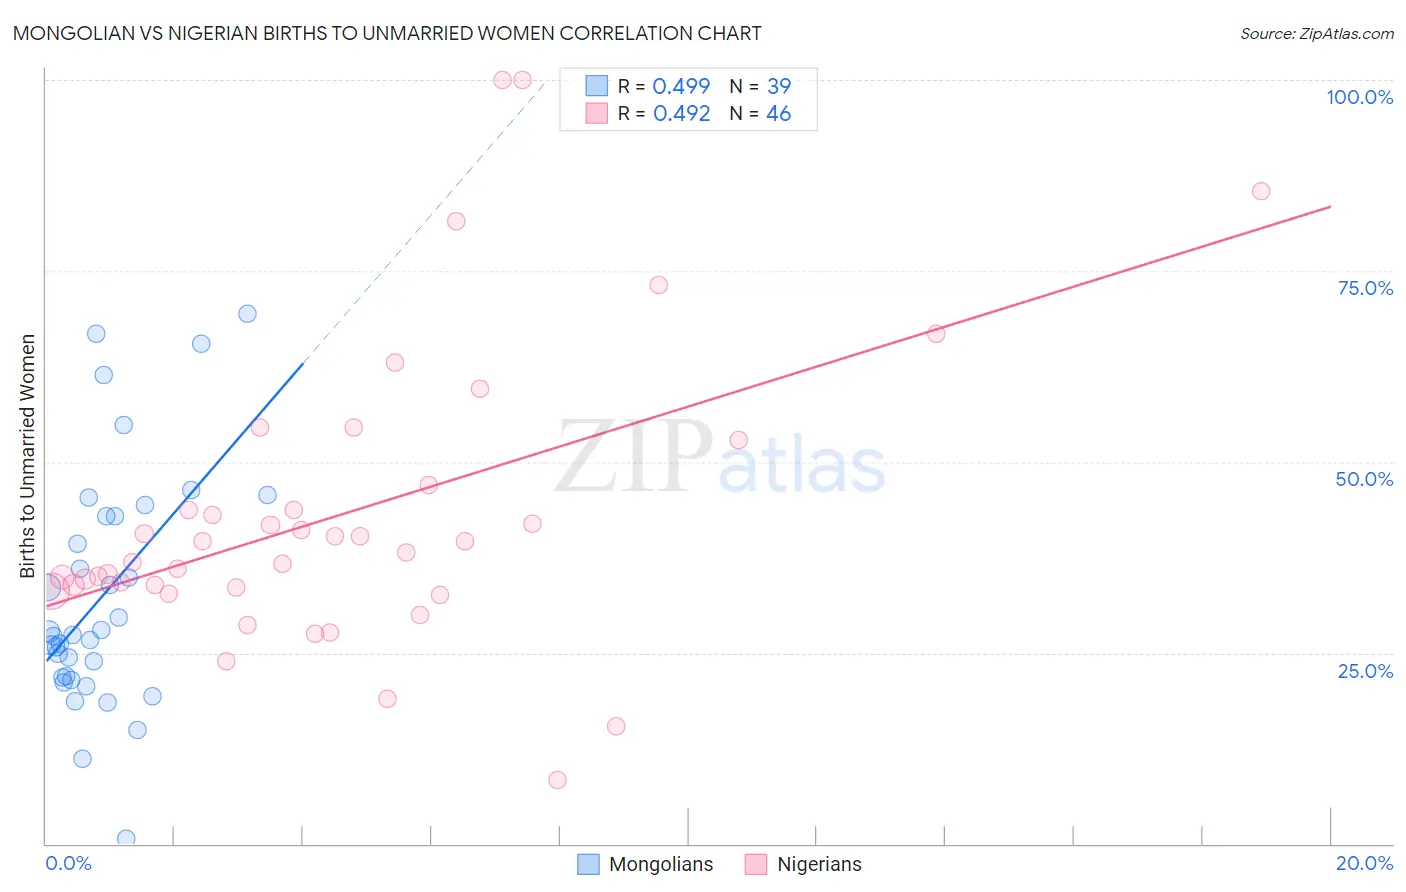
Mongolian vs Nigerian Births to Unmarried Women Correlation Chart
The statistical analysis conducted on geographies consisting of 135,823,191 people shows a moderate positive correlation between the proportion of Mongolians and percentage of births to unmarried women in the United States with a correlation coefficient (R) of 0.499 and weighted average of 27.9%. Similarly, the statistical analysis conducted on geographies consisting of 318,352,588 people shows a moderate positive correlation between the proportion of Nigerians and percentage of births to unmarried women in the United States with a correlation coefficient (R) of 0.492 and weighted average of 35.3%, a difference of 26.6%.
Births to Unmarried Women Correlation Summary
| Measurement | Mongolian | Nigerian |
| Minimum | 0.60% | 8.3% |
| Maximum | 69.4% | 100.0% |
| Range | 68.8% | 91.7% |
| Mean | 32.6% | 43.4% |
| Median | 27.3% | 38.8% |
| Interquartile 25% (IQ1) | 21.7% | 33.6% |
| Interquartile 75% (IQ3) | 42.9% | 46.9% |
| Interquartile Range (IQR) | 21.2% | 13.3% |
| Standard Deviation (Sample) | 15.7% | 19.5% |
| Standard Deviation (Population) | 15.5% | 19.3% |
Similar Demographics by Births to Unmarried Women
Demographics Similar to Mongolians by Births to Unmarried Women
In terms of births to unmarried women, the demographic groups most similar to Mongolians are Afghan (27.9%, a difference of 0.040%), Immigrants from Romania (27.9%, a difference of 0.11%), Bhutanese (27.9%, a difference of 0.12%), Macedonian (27.9%, a difference of 0.16%), and Immigrants from Belgium (28.0%, a difference of 0.26%).
| Demographics | Rating | Rank | Births to Unmarried Women |
| Eastern Europeans | 99.5 /100 | #48 | Exceptional 27.7% |
| Immigrants | Greece | 99.4 /100 | #49 | Exceptional 27.8% |
| Maltese | 99.4 /100 | #50 | Exceptional 27.8% |
| Macedonians | 99.4 /100 | #51 | Exceptional 27.9% |
| Bhutanese | 99.4 /100 | #52 | Exceptional 27.9% |
| Immigrants | Romania | 99.4 /100 | #53 | Exceptional 27.9% |
| Afghans | 99.4 /100 | #54 | Exceptional 27.9% |
| Mongolians | 99.3 /100 | #55 | Exceptional 27.9% |
| Immigrants | Belgium | 99.3 /100 | #56 | Exceptional 28.0% |
| Russians | 99.2 /100 | #57 | Exceptional 28.0% |
| Immigrants | Albania | 99.2 /100 | #58 | Exceptional 28.0% |
| Immigrants | Kazakhstan | 99.1 /100 | #59 | Exceptional 28.1% |
| Immigrants | Turkey | 99.1 /100 | #60 | Exceptional 28.1% |
| Immigrants | North Macedonia | 99.1 /100 | #61 | Exceptional 28.1% |
| Egyptians | 99.0 /100 | #62 | Exceptional 28.2% |
Demographics Similar to Nigerians by Births to Unmarried Women
In terms of births to unmarried women, the demographic groups most similar to Nigerians are Shoshone (35.3%, a difference of 0.11%), Immigrants from Nigeria (35.4%, a difference of 0.21%), Guyanese (35.2%, a difference of 0.45%), Japanese (35.2%, a difference of 0.51%), and Nonimmigrants (35.5%, a difference of 0.54%).
| Demographics | Rating | Rank | Births to Unmarried Women |
| Sierra Leoneans | 1.4 /100 | #239 | Tragic 34.9% |
| Immigrants | Middle Africa | 1.2 /100 | #240 | Tragic 34.9% |
| Immigrants | Guyana | 1.2 /100 | #241 | Tragic 35.0% |
| Indonesians | 1.2 /100 | #242 | Tragic 35.0% |
| Japanese | 0.9 /100 | #243 | Tragic 35.2% |
| Guyanese | 0.9 /100 | #244 | Tragic 35.2% |
| Shoshone | 0.8 /100 | #245 | Tragic 35.3% |
| Nigerians | 0.7 /100 | #246 | Tragic 35.3% |
| Immigrants | Nigeria | 0.7 /100 | #247 | Tragic 35.4% |
| Immigrants | Nonimmigrants | 0.6 /100 | #248 | Tragic 35.5% |
| Bermudans | 0.6 /100 | #249 | Tragic 35.5% |
| Mexican American Indians | 0.4 /100 | #250 | Tragic 35.7% |
| Immigrants | Western Africa | 0.3 /100 | #251 | Tragic 36.0% |
| Salvadorans | 0.3 /100 | #252 | Tragic 36.0% |
| Immigrants | Portugal | 0.2 /100 | #253 | Tragic 36.2% |