Moroccan vs Immigrants from Liberia Married-couple Households
COMPARE
Moroccan
Immigrants from Liberia
Married-couple Households
Married-couple Households Comparison
Moroccans
Immigrants from Liberia
43.5%
MARRIED-COUPLE HOUSEHOLDS
0.1/ 100
METRIC RATING
265th/ 347
METRIC RANK
40.3%
MARRIED-COUPLE HOUSEHOLDS
0.0/ 100
METRIC RATING
321st/ 347
METRIC RANK
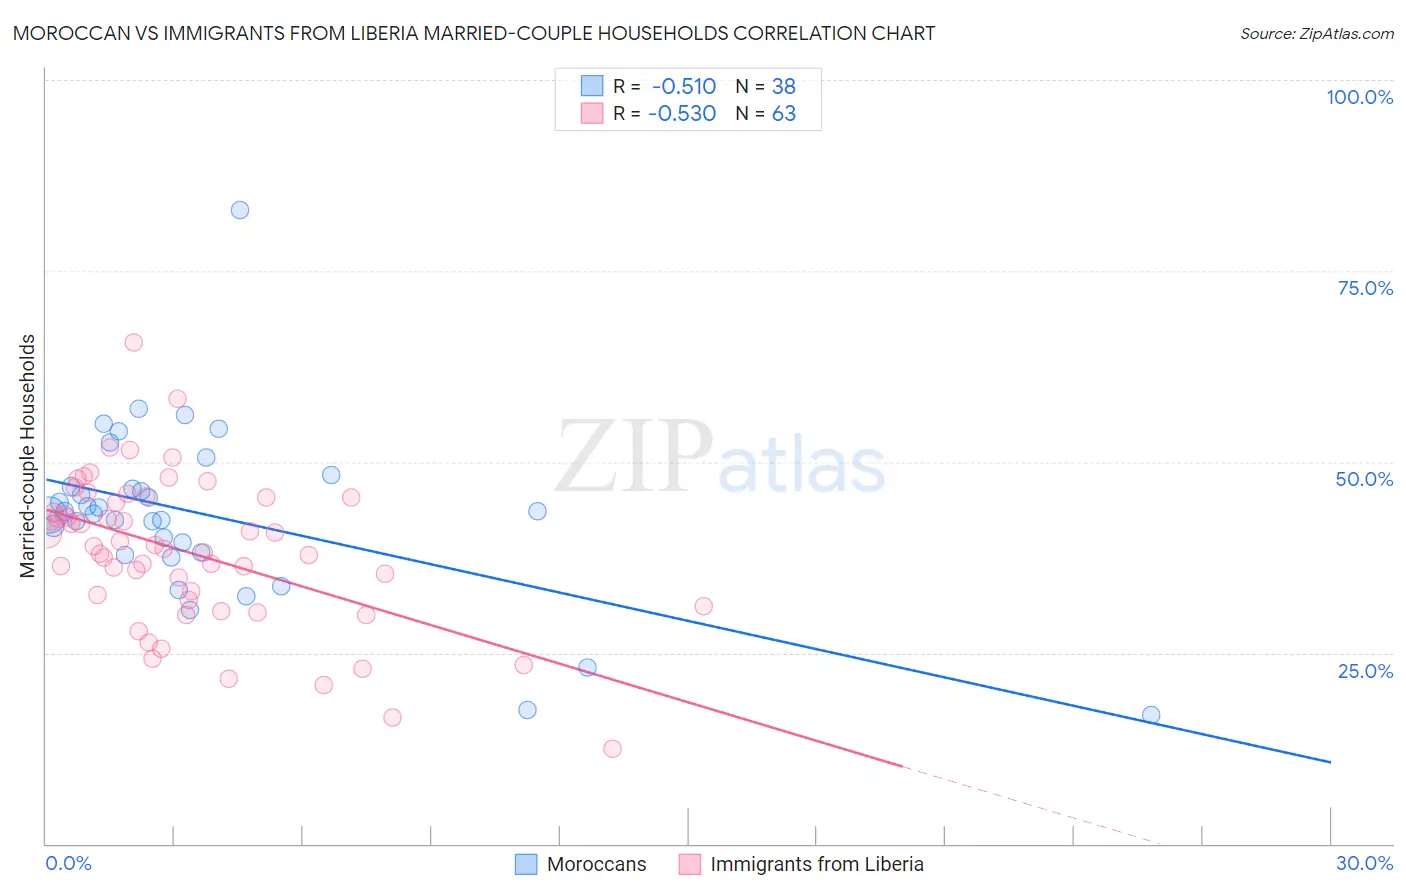
Moroccan vs Immigrants from Liberia Married-couple Households Correlation Chart
The statistical analysis conducted on geographies consisting of 201,755,880 people shows a substantial negative correlation between the proportion of Moroccans and percentage of married-couple family households in the United States with a correlation coefficient (R) of -0.510 and weighted average of 43.5%. Similarly, the statistical analysis conducted on geographies consisting of 135,232,319 people shows a substantial negative correlation between the proportion of Immigrants from Liberia and percentage of married-couple family households in the United States with a correlation coefficient (R) of -0.530 and weighted average of 40.3%, a difference of 7.8%.
Married-couple Households Correlation Summary
| Measurement | Moroccan | Immigrants from Liberia |
| Minimum | 16.8% | 12.5% |
| Maximum | 83.0% | 65.7% |
| Range | 66.2% | 53.2% |
| Mean | 43.1% | 38.2% |
| Median | 43.3% | 39.0% |
| Interquartile 25% (IQ1) | 38.2% | 32.0% |
| Interquartile 75% (IQ3) | 46.7% | 45.3% |
| Interquartile Range (IQR) | 8.5% | 13.3% |
| Standard Deviation (Sample) | 11.5% | 9.8% |
| Standard Deviation (Population) | 11.3% | 9.7% |
Similar Demographics by Married-couple Households
Demographics Similar to Moroccans by Married-couple Households
In terms of married-couple households, the demographic groups most similar to Moroccans are Ecuadorian (43.5%, a difference of 0.040%), Bangladeshi (43.5%, a difference of 0.080%), Native/Alaskan (43.5%, a difference of 0.090%), Cree (43.6%, a difference of 0.19%), and Immigrants from Burma/Myanmar (43.4%, a difference of 0.20%).
| Demographics | Rating | Rank | Married-couple Households |
| Central American Indians | 0.2 /100 | #258 | Tragic 43.8% |
| Iroquois | 0.2 /100 | #259 | Tragic 43.7% |
| Immigrants | Cameroon | 0.2 /100 | #260 | Tragic 43.7% |
| Alaskan Athabascans | 0.2 /100 | #261 | Tragic 43.6% |
| Vietnamese | 0.2 /100 | #262 | Tragic 43.6% |
| Cree | 0.1 /100 | #263 | Tragic 43.6% |
| Bangladeshis | 0.1 /100 | #264 | Tragic 43.5% |
| Moroccans | 0.1 /100 | #265 | Tragic 43.5% |
| Ecuadorians | 0.1 /100 | #266 | Tragic 43.5% |
| Natives/Alaskans | 0.1 /100 | #267 | Tragic 43.5% |
| Immigrants | Burma/Myanmar | 0.1 /100 | #268 | Tragic 43.4% |
| Immigrants | Sierra Leone | 0.1 /100 | #269 | Tragic 43.3% |
| Yuman | 0.1 /100 | #270 | Tragic 43.3% |
| Guatemalans | 0.1 /100 | #271 | Tragic 43.3% |
| Immigrants | Nigeria | 0.1 /100 | #272 | Tragic 43.2% |
Demographics Similar to Immigrants from Liberia by Married-couple Households
In terms of married-couple households, the demographic groups most similar to Immigrants from Liberia are West Indian (40.3%, a difference of 0.040%), Bahamian (40.5%, a difference of 0.45%), Immigrants from Zaire (40.1%, a difference of 0.66%), Puerto Rican (40.1%, a difference of 0.66%), and Navajo (40.1%, a difference of 0.67%).
| Demographics | Rating | Rank | Married-couple Households |
| Jamaicans | 0.0 /100 | #314 | Tragic 40.9% |
| Trinidadians and Tobagonians | 0.0 /100 | #315 | Tragic 40.9% |
| Immigrants | Caribbean | 0.0 /100 | #316 | Tragic 40.8% |
| Immigrants | Jamaica | 0.0 /100 | #317 | Tragic 40.7% |
| Liberians | 0.0 /100 | #318 | Tragic 40.7% |
| Bahamians | 0.0 /100 | #319 | Tragic 40.5% |
| West Indians | 0.0 /100 | #320 | Tragic 40.3% |
| Immigrants | Liberia | 0.0 /100 | #321 | Tragic 40.3% |
| Immigrants | Zaire | 0.0 /100 | #322 | Tragic 40.1% |
| Puerto Ricans | 0.0 /100 | #323 | Tragic 40.1% |
| Navajo | 0.0 /100 | #324 | Tragic 40.1% |
| Pueblo | 0.0 /100 | #325 | Tragic 40.0% |
| U.S. Virgin Islanders | 0.0 /100 | #326 | Tragic 39.8% |
| Lumbee | 0.0 /100 | #327 | Tragic 39.6% |
| Barbadians | 0.0 /100 | #328 | Tragic 39.4% |