Native/Alaskan vs Maltese Births to Unmarried Women
COMPARE
Native/Alaskan
Maltese
Births to Unmarried Women
Births to Unmarried Women Comparison
Natives/Alaskans
Maltese
43.0%
BIRTHS TO UNMARRIED WOMEN
0.0/ 100
METRIC RATING
331st/ 347
METRIC RANK
27.8%
BIRTHS TO UNMARRIED WOMEN
99.4/ 100
METRIC RATING
50th/ 347
METRIC RANK
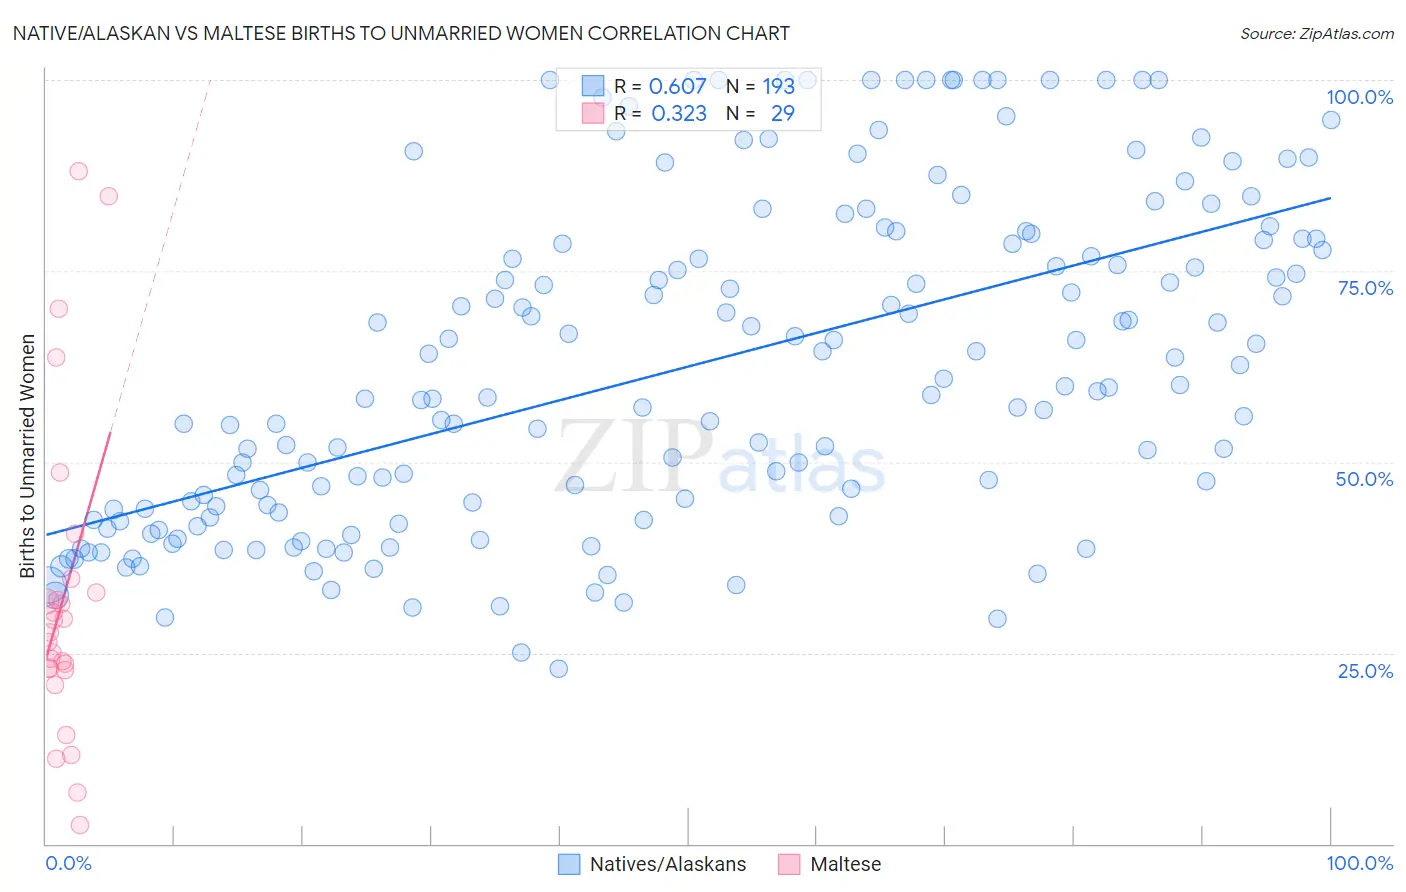
Native/Alaskan vs Maltese Births to Unmarried Women Correlation Chart
The statistical analysis conducted on geographies consisting of 471,404,476 people shows a significant positive correlation between the proportion of Natives/Alaskans and percentage of births to unmarried women in the United States with a correlation coefficient (R) of 0.607 and weighted average of 43.0%. Similarly, the statistical analysis conducted on geographies consisting of 121,147,000 people shows a mild positive correlation between the proportion of Maltese and percentage of births to unmarried women in the United States with a correlation coefficient (R) of 0.323 and weighted average of 27.8%, a difference of 54.5%.
Births to Unmarried Women Correlation Summary
| Measurement | Native/Alaskan | Maltese |
| Minimum | 22.9% | 2.4% |
| Maximum | 100.0% | 88.0% |
| Range | 77.1% | 85.6% |
| Mean | 62.5% | 32.2% |
| Median | 59.8% | 27.6% |
| Interquartile 25% (IQ1) | 43.2% | 22.9% |
| Interquartile 75% (IQ3) | 79.1% | 33.8% |
| Interquartile Range (IQR) | 35.9% | 10.9% |
| Standard Deviation (Sample) | 21.3% | 20.8% |
| Standard Deviation (Population) | 21.3% | 20.4% |
Similar Demographics by Births to Unmarried Women
Demographics Similar to Natives/Alaskans by Births to Unmarried Women
In terms of births to unmarried women, the demographic groups most similar to Natives/Alaskans are Kiowa (43.1%, a difference of 0.35%), Chippewa (42.6%, a difference of 0.83%), Paiute (42.5%, a difference of 1.2%), Immigrants from Cabo Verde (42.2%, a difference of 1.8%), and Tsimshian (42.2%, a difference of 2.0%).
| Demographics | Rating | Rank | Births to Unmarried Women |
| Cape Verdeans | 0.0 /100 | #324 | Tragic 41.3% |
| Cheyenne | 0.0 /100 | #325 | Tragic 41.3% |
| Immigrants | Cuba | 0.0 /100 | #326 | Tragic 41.5% |
| Tsimshian | 0.0 /100 | #327 | Tragic 42.2% |
| Immigrants | Cabo Verde | 0.0 /100 | #328 | Tragic 42.2% |
| Paiute | 0.0 /100 | #329 | Tragic 42.5% |
| Chippewa | 0.0 /100 | #330 | Tragic 42.6% |
| Natives/Alaskans | 0.0 /100 | #331 | Tragic 43.0% |
| Kiowa | 0.0 /100 | #332 | Tragic 43.1% |
| Blacks/African Americans | 0.0 /100 | #333 | Tragic 44.3% |
| Yuman | 0.0 /100 | #334 | Tragic 44.4% |
| Colville | 0.0 /100 | #335 | Tragic 45.3% |
| Puerto Ricans | 0.0 /100 | #336 | Tragic 45.7% |
| Houma | 0.0 /100 | #337 | Tragic 46.6% |
| Arapaho | 0.0 /100 | #338 | Tragic 47.1% |
Demographics Similar to Maltese by Births to Unmarried Women
In terms of births to unmarried women, the demographic groups most similar to Maltese are Immigrants from Greece (27.8%, a difference of 0.12%), Macedonian (27.9%, a difference of 0.13%), Bhutanese (27.9%, a difference of 0.17%), Immigrants from Romania (27.9%, a difference of 0.19%), and Afghan (27.9%, a difference of 0.25%).
| Demographics | Rating | Rank | Births to Unmarried Women |
| Immigrants | Bulgaria | 99.6 /100 | #43 | Exceptional 27.6% |
| Immigrants | Indonesia | 99.5 /100 | #44 | Exceptional 27.7% |
| Latvians | 99.5 /100 | #45 | Exceptional 27.7% |
| Immigrants | Lithuania | 99.5 /100 | #46 | Exceptional 27.7% |
| Hmong | 99.5 /100 | #47 | Exceptional 27.7% |
| Eastern Europeans | 99.5 /100 | #48 | Exceptional 27.7% |
| Immigrants | Greece | 99.4 /100 | #49 | Exceptional 27.8% |
| Maltese | 99.4 /100 | #50 | Exceptional 27.8% |
| Macedonians | 99.4 /100 | #51 | Exceptional 27.9% |
| Bhutanese | 99.4 /100 | #52 | Exceptional 27.9% |
| Immigrants | Romania | 99.4 /100 | #53 | Exceptional 27.9% |
| Afghans | 99.4 /100 | #54 | Exceptional 27.9% |
| Mongolians | 99.3 /100 | #55 | Exceptional 27.9% |
| Immigrants | Belgium | 99.3 /100 | #56 | Exceptional 28.0% |
| Russians | 99.2 /100 | #57 | Exceptional 28.0% |