Russian vs Ecuadorian Family Households
COMPARE
Russian
Ecuadorian
Family Households
Family Households Comparison
Russians
Ecuadorians
63.4%
FAMILY HOUSEHOLDS
1.4/ 100
METRIC RATING
249th/ 347
METRIC RANK
65.0%
FAMILY HOUSEHOLDS
95.4/ 100
METRIC RATING
115th/ 347
METRIC RANK
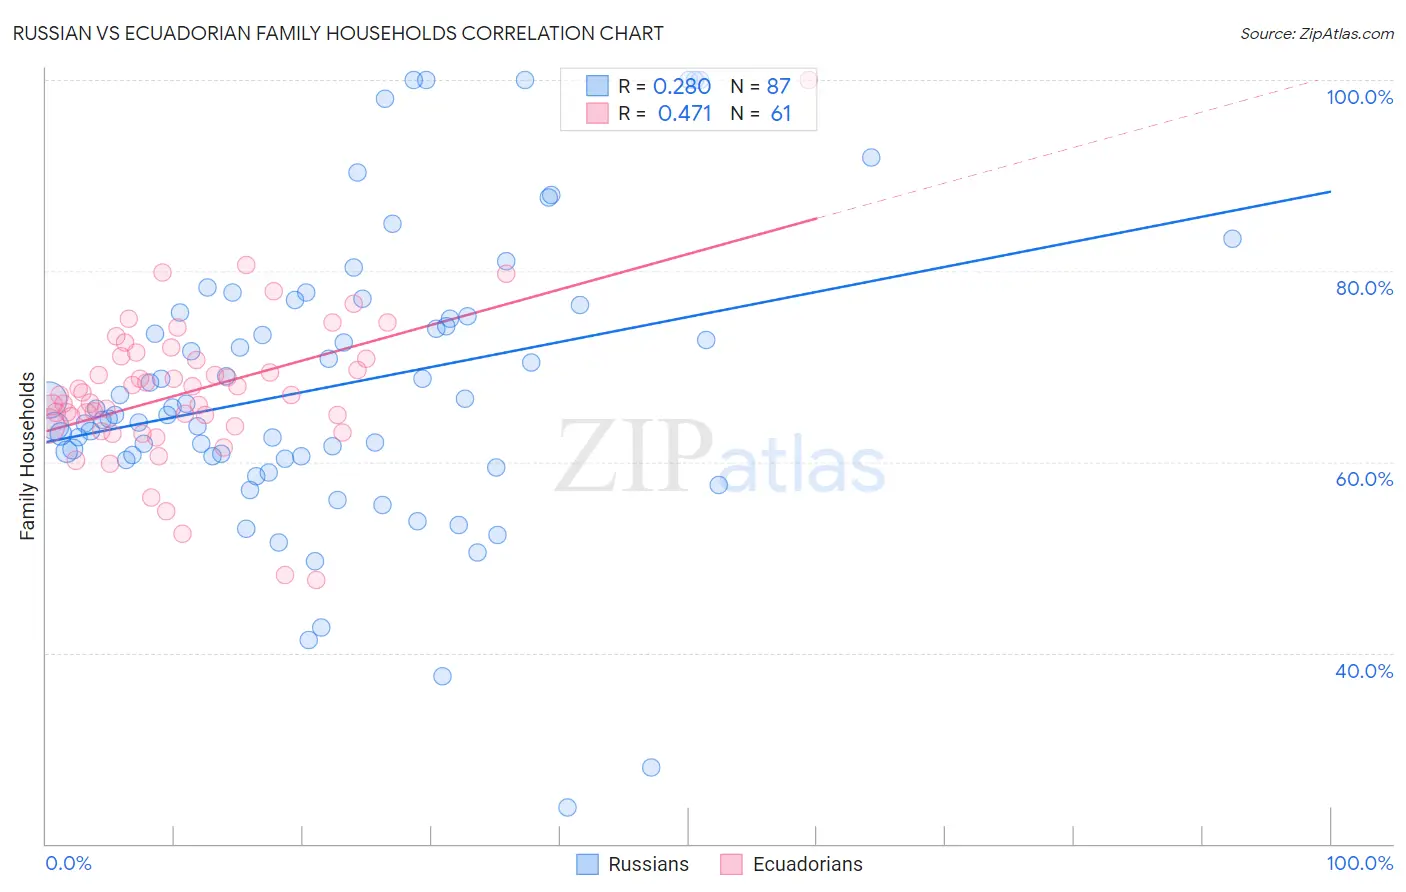
Russian vs Ecuadorian Family Households Correlation Chart
The statistical analysis conducted on geographies consisting of 511,741,989 people shows a weak positive correlation between the proportion of Russians and percentage of family households in the United States with a correlation coefficient (R) of 0.280 and weighted average of 63.4%. Similarly, the statistical analysis conducted on geographies consisting of 317,646,947 people shows a moderate positive correlation between the proportion of Ecuadorians and percentage of family households in the United States with a correlation coefficient (R) of 0.471 and weighted average of 65.0%, a difference of 2.5%.
Family Households Correlation Summary
| Measurement | Russian | Ecuadorian |
| Minimum | 23.8% | 47.6% |
| Maximum | 100.0% | 100.0% |
| Range | 76.2% | 52.4% |
| Mean | 68.0% | 67.4% |
| Median | 65.5% | 67.1% |
| Interquartile 25% (IQ1) | 60.6% | 63.8% |
| Interquartile 75% (IQ3) | 75.7% | 71.0% |
| Interquartile Range (IQR) | 15.1% | 7.2% |
| Standard Deviation (Sample) | 15.2% | 7.9% |
| Standard Deviation (Population) | 15.1% | 7.8% |
Similar Demographics by Family Households
Demographics Similar to Russians by Family Households
In terms of family households, the demographic groups most similar to Russians are Dominican (63.4%, a difference of 0.010%), Immigrants from Japan (63.4%, a difference of 0.010%), Immigrants from Uzbekistan (63.4%, a difference of 0.020%), Immigrants from Ghana (63.4%, a difference of 0.030%), and Eastern European (63.4%, a difference of 0.050%).
| Demographics | Rating | Rank | Family Households |
| Immigrants | Israel | 1.8 /100 | #242 | Tragic 63.4% |
| Immigrants | Czechoslovakia | 1.8 /100 | #243 | Tragic 63.4% |
| Eastern Europeans | 1.6 /100 | #244 | Tragic 63.4% |
| Immigrants | Dominica | 1.6 /100 | #245 | Tragic 63.4% |
| Immigrants | Ghana | 1.6 /100 | #246 | Tragic 63.4% |
| Immigrants | Uzbekistan | 1.5 /100 | #247 | Tragic 63.4% |
| Dominicans | 1.5 /100 | #248 | Tragic 63.4% |
| Russians | 1.4 /100 | #249 | Tragic 63.4% |
| Immigrants | Japan | 1.4 /100 | #250 | Tragic 63.4% |
| Taiwanese | 1.2 /100 | #251 | Tragic 63.3% |
| Bahamians | 1.1 /100 | #252 | Tragic 63.3% |
| Immigrants | Dominican Republic | 1.0 /100 | #253 | Tragic 63.3% |
| Slovaks | 1.0 /100 | #254 | Tragic 63.3% |
| Potawatomi | 1.0 /100 | #255 | Tragic 63.3% |
| Luxembourgers | 0.9 /100 | #256 | Tragic 63.3% |
Demographics Similar to Ecuadorians by Family Households
In terms of family households, the demographic groups most similar to Ecuadorians are Immigrants from Iraq (65.0%, a difference of 0.0%), Cherokee (65.0%, a difference of 0.010%), Dutch (64.9%, a difference of 0.020%), Argentinean (65.0%, a difference of 0.030%), and Spanish (65.0%, a difference of 0.060%).
| Demographics | Rating | Rank | Family Households |
| Palestinians | 97.2 /100 | #108 | Exceptional 65.1% |
| Immigrants | Guatemala | 96.9 /100 | #109 | Exceptional 65.0% |
| Scandinavians | 96.8 /100 | #110 | Exceptional 65.0% |
| Europeans | 96.8 /100 | #111 | Exceptional 65.0% |
| Immigrants | Jordan | 96.5 /100 | #112 | Exceptional 65.0% |
| Spanish | 96.2 /100 | #113 | Exceptional 65.0% |
| Argentineans | 95.7 /100 | #114 | Exceptional 65.0% |
| Ecuadorians | 95.4 /100 | #115 | Exceptional 65.0% |
| Immigrants | Iraq | 95.4 /100 | #116 | Exceptional 65.0% |
| Cherokee | 95.3 /100 | #117 | Exceptional 65.0% |
| Dutch | 95.1 /100 | #118 | Exceptional 64.9% |
| Immigrants | Eastern Asia | 94.4 /100 | #119 | Exceptional 64.9% |
| Immigrants | Oceania | 94.2 /100 | #120 | Exceptional 64.9% |
| Hungarians | 94.0 /100 | #121 | Exceptional 64.9% |
| Hmong | 93.4 /100 | #122 | Exceptional 64.9% |