Soviet Union vs Ecuadorian Births to Unmarried Women
COMPARE
Soviet Union
Ecuadorian
Births to Unmarried Women
Births to Unmarried Women Comparison
Soviet Union
Ecuadorians
26.3%
BIRTHS TO UNMARRIED WOMEN
99.9/ 100
METRIC RATING
21st/ 347
METRIC RANK
33.3%
BIRTHS TO UNMARRIED WOMEN
10.5/ 100
METRIC RATING
211th/ 347
METRIC RANK
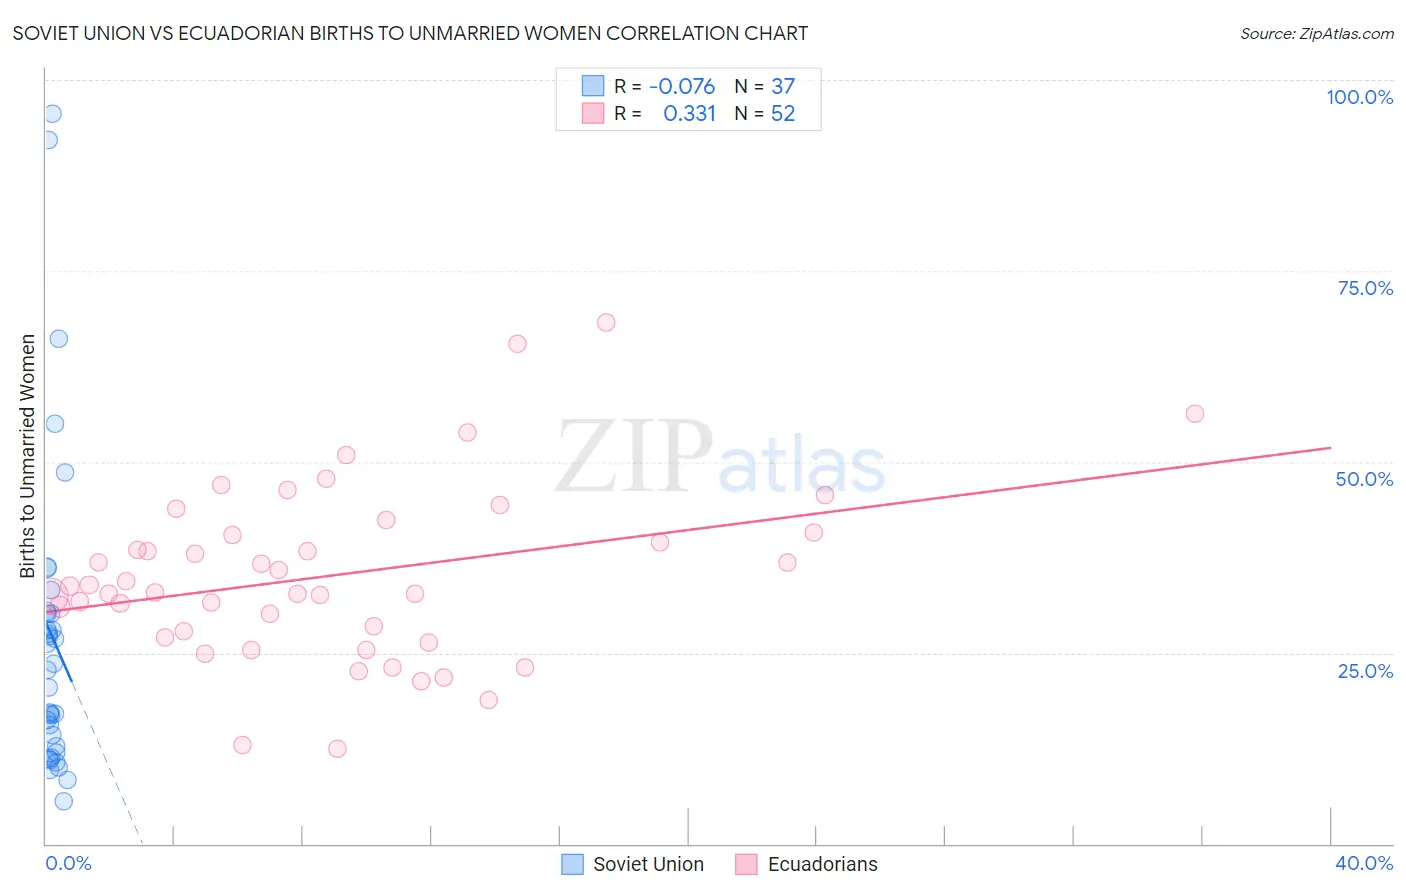
Soviet Union vs Ecuadorian Births to Unmarried Women Correlation Chart
The statistical analysis conducted on geographies consisting of 42,942,883 people shows a slight negative correlation between the proportion of Soviet Union and percentage of births to unmarried women in the United States with a correlation coefficient (R) of -0.076 and weighted average of 26.3%. Similarly, the statistical analysis conducted on geographies consisting of 300,726,329 people shows a mild positive correlation between the proportion of Ecuadorians and percentage of births to unmarried women in the United States with a correlation coefficient (R) of 0.331 and weighted average of 33.3%, a difference of 26.5%.
Births to Unmarried Women Correlation Summary
| Measurement | Soviet Union | Ecuadorian |
| Minimum | 5.5% | 12.5% |
| Maximum | 95.6% | 68.3% |
| Range | 90.1% | 55.8% |
| Mean | 27.0% | 35.1% |
| Median | 22.8% | 33.3% |
| Interquartile 25% (IQ1) | 12.3% | 27.4% |
| Interquartile 75% (IQ3) | 30.3% | 40.6% |
| Interquartile Range (IQR) | 18.0% | 13.2% |
| Standard Deviation (Sample) | 20.9% | 11.5% |
| Standard Deviation (Population) | 20.6% | 11.3% |
Similar Demographics by Births to Unmarried Women
Demographics Similar to Soviet Union by Births to Unmarried Women
In terms of births to unmarried women, the demographic groups most similar to Soviet Union are Immigrants from Korea (26.3%, a difference of 0.13%), Burmese (26.4%, a difference of 0.22%), Armenian (26.2%, a difference of 0.35%), Immigrants from Japan (26.4%, a difference of 0.41%), and Immigrants from Armenia (26.1%, a difference of 0.93%).
| Demographics | Rating | Rank | Births to Unmarried Women |
| Immigrants | Lebanon | 100.0 /100 | #14 | Exceptional 25.3% |
| Immigrants | Singapore | 100.0 /100 | #15 | Exceptional 25.6% |
| Immigrants | Belarus | 100.0 /100 | #16 | Exceptional 25.6% |
| Immigrants | Uzbekistan | 100.0 /100 | #17 | Exceptional 25.8% |
| Immigrants | Armenia | 99.9 /100 | #18 | Exceptional 26.1% |
| Armenians | 99.9 /100 | #19 | Exceptional 26.2% |
| Immigrants | Korea | 99.9 /100 | #20 | Exceptional 26.3% |
| Soviet Union | 99.9 /100 | #21 | Exceptional 26.3% |
| Burmese | 99.9 /100 | #22 | Exceptional 26.4% |
| Immigrants | Japan | 99.9 /100 | #23 | Exceptional 26.4% |
| Immigrants | Australia | 99.9 /100 | #24 | Exceptional 26.6% |
| Cambodians | 99.9 /100 | #25 | Exceptional 26.7% |
| Asians | 99.9 /100 | #26 | Exceptional 26.8% |
| Immigrants | Asia | 99.9 /100 | #27 | Exceptional 26.8% |
| Okinawans | 99.8 /100 | #28 | Exceptional 26.9% |
Demographics Similar to Ecuadorians by Births to Unmarried Women
In terms of births to unmarried women, the demographic groups most similar to Ecuadorians are White/Caucasian (33.3%, a difference of 0.050%), Scotch-Irish (33.3%, a difference of 0.050%), Celtic (33.3%, a difference of 0.070%), Hawaiian (33.2%, a difference of 0.19%), and Immigrants from Sudan (33.2%, a difference of 0.22%).
| Demographics | Rating | Rank | Births to Unmarried Women |
| Immigrants | Africa | 14.3 /100 | #204 | Poor 33.0% |
| German Russians | 13.1 /100 | #205 | Poor 33.1% |
| Uruguayans | 12.8 /100 | #206 | Poor 33.1% |
| Immigrants | Sudan | 11.5 /100 | #207 | Poor 33.2% |
| Hawaiians | 11.3 /100 | #208 | Poor 33.2% |
| Whites/Caucasians | 10.7 /100 | #209 | Poor 33.3% |
| Scotch-Irish | 10.7 /100 | #210 | Poor 33.3% |
| Ecuadorians | 10.5 /100 | #211 | Poor 33.3% |
| Celtics | 10.2 /100 | #212 | Poor 33.3% |
| Immigrants | Costa Rica | 9.5 /100 | #213 | Tragic 33.4% |
| Slovaks | 9.3 /100 | #214 | Tragic 33.4% |
| French | 8.7 /100 | #215 | Tragic 33.4% |
| Nepalese | 7.8 /100 | #216 | Tragic 33.5% |
| Spaniards | 7.0 /100 | #217 | Tragic 33.6% |
| Immigrants | Ecuador | 5.9 /100 | #218 | Tragic 33.7% |