Swedish vs Hungarian Average Family Size
COMPARE
Swedish
Hungarian
Average Family Size
Average Family Size Comparison
Swedes
Hungarians
3.10
AVERAGE FAMILY SIZE
0.0/ 100
METRIC RATING
337th/ 347
METRIC RANK
3.18
AVERAGE FAMILY SIZE
3.0/ 100
METRIC RATING
242nd/ 347
METRIC RANK
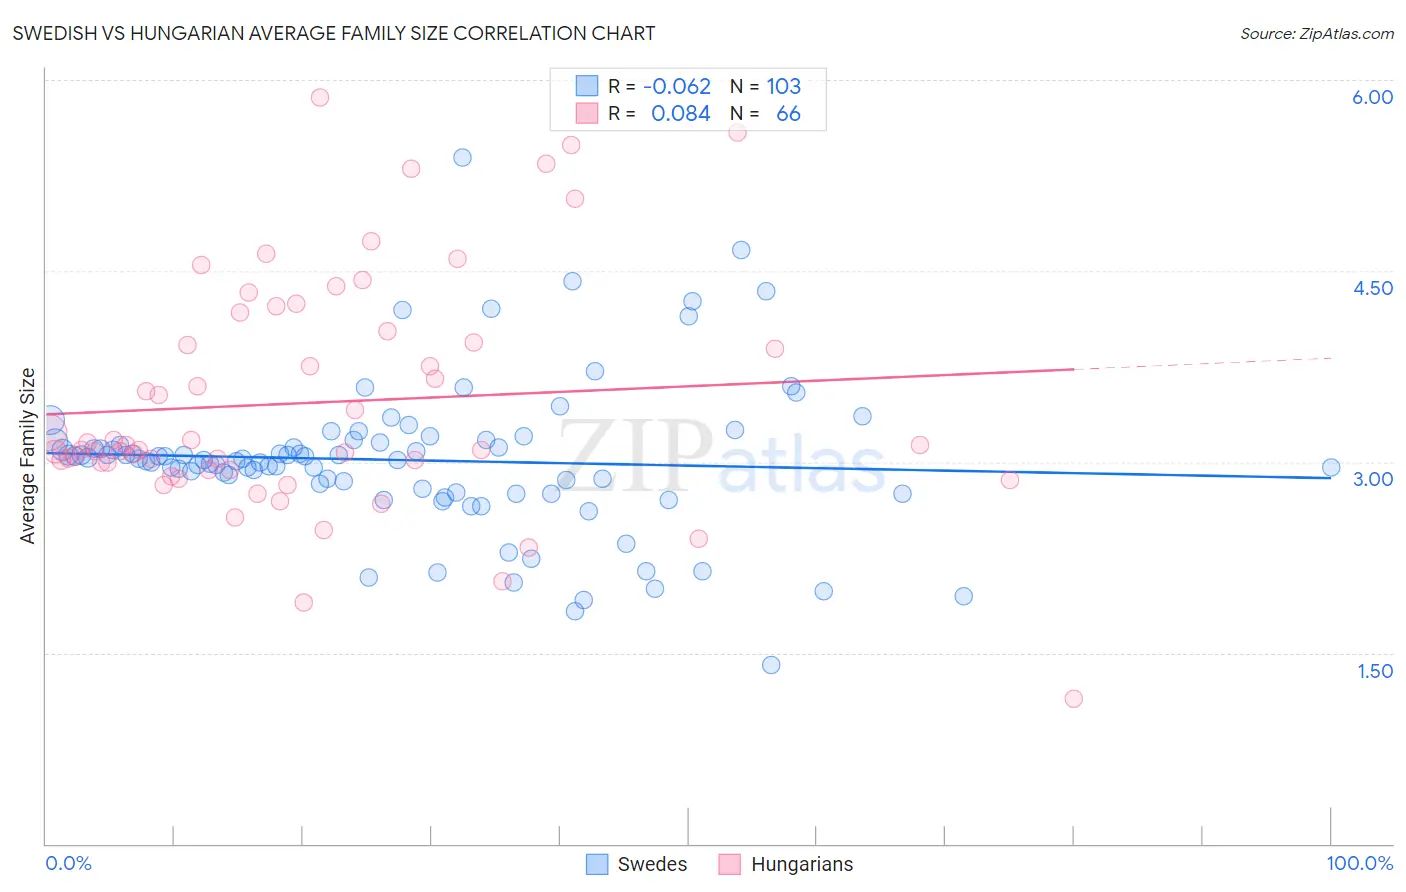
Swedish vs Hungarian Average Family Size Correlation Chart
The statistical analysis conducted on geographies consisting of 538,762,324 people shows a slight negative correlation between the proportion of Swedes and average family size in the United States with a correlation coefficient (R) of -0.062 and weighted average of 3.10. Similarly, the statistical analysis conducted on geographies consisting of 485,906,700 people shows a slight positive correlation between the proportion of Hungarians and average family size in the United States with a correlation coefficient (R) of 0.084 and weighted average of 3.18, a difference of 2.5%.
Average Family Size Correlation Summary
| Measurement | Swedish | Hungarian |
| Minimum | 1.40 | 1.14 |
| Maximum | 5.39 | 5.86 |
| Range | 3.99 | 4.72 |
| Mean | 3.01 | 3.47 |
| Median | 3.02 | 3.11 |
| Interquartile 25% (IQ1) | 2.79 | 2.94 |
| Interquartile 75% (IQ3) | 3.16 | 4.03 |
| Interquartile Range (IQR) | 0.37 | 1.09 |
| Standard Deviation (Sample) | 0.59 | 0.93 |
| Standard Deviation (Population) | 0.59 | 0.92 |
Similar Demographics by Average Family Size
Demographics Similar to Swedes by Average Family Size
In terms of average family size, the demographic groups most similar to Swedes are French (3.10, a difference of 0.020%), Irish (3.10, a difference of 0.030%), Croatian (3.10, a difference of 0.030%), Luxembourger (3.10, a difference of 0.090%), and Lithuanian (3.10, a difference of 0.12%).
| Demographics | Rating | Rank | Average Family Size |
| Latvians | 0.0 /100 | #330 | Tragic 3.11 |
| Scotch-Irish | 0.0 /100 | #331 | Tragic 3.11 |
| Scottish | 0.0 /100 | #332 | Tragic 3.11 |
| Estonians | 0.0 /100 | #333 | Tragic 3.10 |
| Lithuanians | 0.0 /100 | #334 | Tragic 3.10 |
| Luxembourgers | 0.0 /100 | #335 | Tragic 3.10 |
| Irish | 0.0 /100 | #336 | Tragic 3.10 |
| Swedes | 0.0 /100 | #337 | Tragic 3.10 |
| French | 0.0 /100 | #338 | Tragic 3.10 |
| Croatians | 0.0 /100 | #339 | Tragic 3.10 |
| Finns | 0.0 /100 | #340 | Tragic 3.09 |
| Poles | 0.0 /100 | #341 | Tragic 3.09 |
| Germans | 0.0 /100 | #342 | Tragic 3.09 |
| Norwegians | 0.0 /100 | #343 | Tragic 3.08 |
| French Canadians | 0.0 /100 | #344 | Tragic 3.07 |
Demographics Similar to Hungarians by Average Family Size
In terms of average family size, the demographic groups most similar to Hungarians are Immigrants from Moldova (3.18, a difference of 0.0%), Immigrants from Southern Europe (3.18, a difference of 0.010%), Immigrants from Japan (3.18, a difference of 0.020%), Osage (3.18, a difference of 0.040%), and Immigrants from Brazil (3.18, a difference of 0.040%).
| Demographics | Rating | Rank | Average Family Size |
| Immigrants | Turkey | 4.2 /100 | #235 | Tragic 3.18 |
| Immigrants | Portugal | 4.2 /100 | #236 | Tragic 3.18 |
| Immigrants | Romania | 3.7 /100 | #237 | Tragic 3.18 |
| Romanians | 3.7 /100 | #238 | Tragic 3.18 |
| Houma | 3.4 /100 | #239 | Tragic 3.18 |
| Osage | 3.2 /100 | #240 | Tragic 3.18 |
| Immigrants | Japan | 3.0 /100 | #241 | Tragic 3.18 |
| Hungarians | 3.0 /100 | #242 | Tragic 3.18 |
| Immigrants | Moldova | 2.9 /100 | #243 | Tragic 3.18 |
| Immigrants | Southern Europe | 2.9 /100 | #244 | Tragic 3.18 |
| Immigrants | Brazil | 2.7 /100 | #245 | Tragic 3.18 |
| Danes | 2.5 /100 | #246 | Tragic 3.17 |
| Cajuns | 2.4 /100 | #247 | Tragic 3.17 |
| Immigrants | Belarus | 2.3 /100 | #248 | Tragic 3.17 |
| Immigrants | Eastern Europe | 2.1 /100 | #249 | Tragic 3.17 |