Yakama vs Soviet Union Family Households with Children
COMPARE
Yakama
Soviet Union
Family Households with Children
Family Households with Children Comparison
Yakama
Soviet Union
30.8%
FAMILY HOUSEHOLDS WITH CHILDREN
100.0/ 100
METRIC RATING
8th/ 347
METRIC RANK
24.8%
FAMILY HOUSEHOLDS WITH CHILDREN
0.0/ 100
METRIC RATING
347th/ 347
METRIC RANK
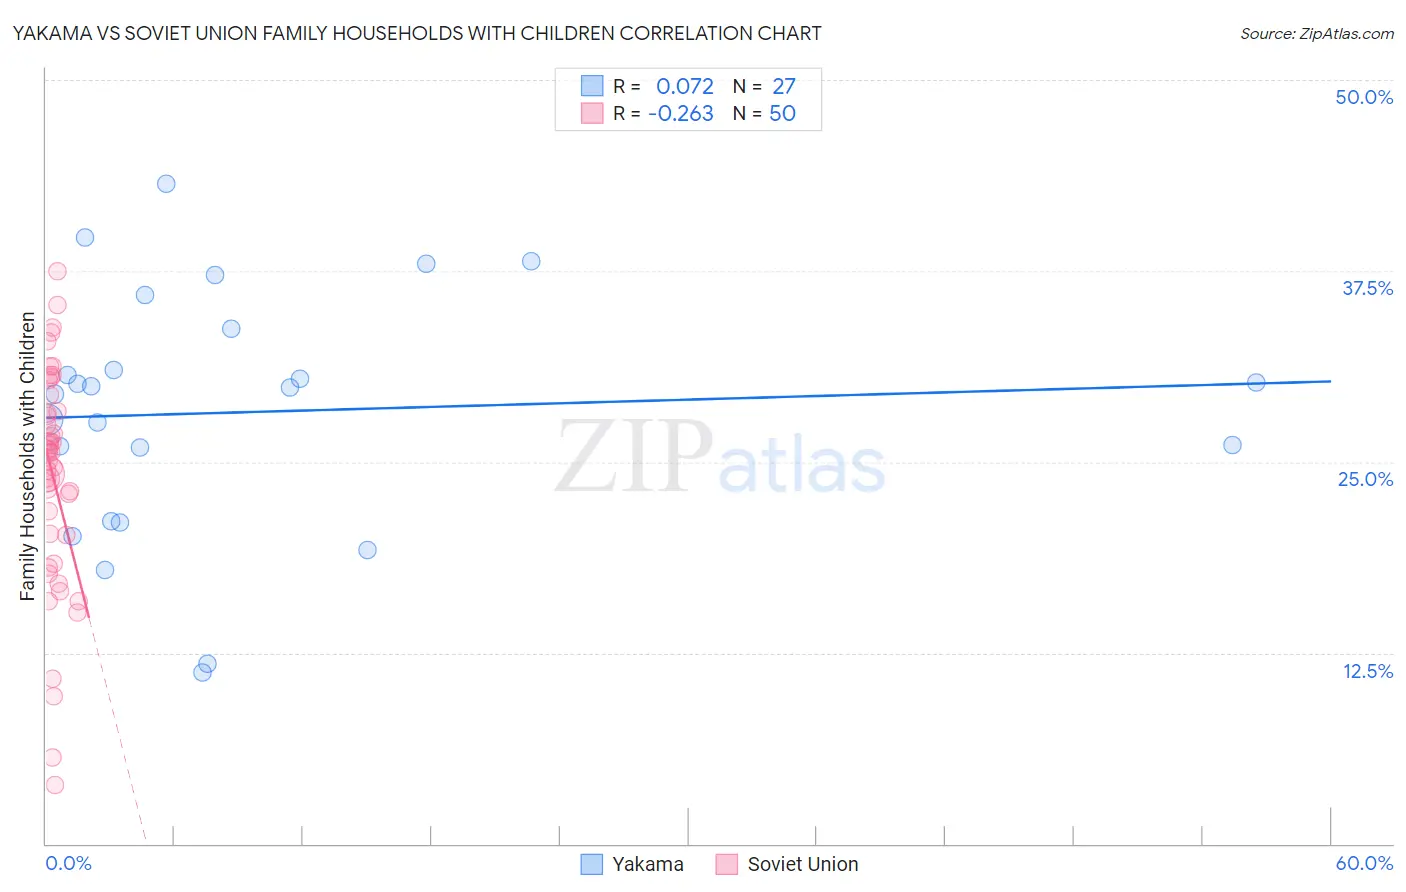
Yakama vs Soviet Union Family Households with Children Correlation Chart
The statistical analysis conducted on geographies consisting of 19,917,879 people shows a slight positive correlation between the proportion of Yakama and percentage of family households with children in the United States with a correlation coefficient (R) of 0.072 and weighted average of 30.8%. Similarly, the statistical analysis conducted on geographies consisting of 43,507,207 people shows a weak negative correlation between the proportion of Soviet Union and percentage of family households with children in the United States with a correlation coefficient (R) of -0.263 and weighted average of 24.8%, a difference of 23.9%.
Family Households with Children Correlation Summary
| Measurement | Yakama | Soviet Union |
| Minimum | 11.2% | 3.9% |
| Maximum | 43.2% | 37.4% |
| Range | 32.0% | 33.6% |
| Mean | 28.3% | 24.0% |
| Median | 29.9% | 25.6% |
| Interquartile 25% (IQ1) | 21.1% | 20.2% |
| Interquartile 75% (IQ3) | 33.7% | 28.3% |
| Interquartile Range (IQR) | 12.6% | 8.1% |
| Standard Deviation (Sample) | 8.0% | 7.2% |
| Standard Deviation (Population) | 7.9% | 7.2% |
Similar Demographics by Family Households with Children
Demographics Similar to Yakama by Family Households with Children
In terms of family households with children, the demographic groups most similar to Yakama are Thai (30.6%, a difference of 0.48%), Immigrants from Central America (31.0%, a difference of 0.57%), Immigrants from Fiji (30.5%, a difference of 0.80%), Immigrants from India (31.0%, a difference of 0.87%), and Nepalese (30.5%, a difference of 0.88%).
| Demographics | Rating | Rank | Family Households with Children |
| Yup'ik | 100 /100 | #1 | Exceptional 37.0% |
| Inupiat | 100 /100 | #2 | Exceptional 32.8% |
| Immigrants | Mexico | 100.0 /100 | #3 | Exceptional 31.6% |
| Mexicans | 100.0 /100 | #4 | Exceptional 31.4% |
| Tongans | 100.0 /100 | #5 | Exceptional 31.2% |
| Immigrants | India | 100.0 /100 | #6 | Exceptional 31.0% |
| Immigrants | Central America | 100.0 /100 | #7 | Exceptional 31.0% |
| Yakama | 100.0 /100 | #8 | Exceptional 30.8% |
| Thais | 100.0 /100 | #9 | Exceptional 30.6% |
| Immigrants | Fiji | 100.0 /100 | #10 | Exceptional 30.5% |
| Nepalese | 100.0 /100 | #11 | Exceptional 30.5% |
| Immigrants | Pakistan | 100.0 /100 | #12 | Exceptional 30.2% |
| Afghans | 100.0 /100 | #13 | Exceptional 30.2% |
| Bangladeshis | 100.0 /100 | #14 | Exceptional 30.1% |
| Immigrants | South Central Asia | 100.0 /100 | #15 | Exceptional 30.0% |
Demographics Similar to Soviet Union by Family Households with Children
In terms of family households with children, the demographic groups most similar to Soviet Union are Immigrants from Grenada (25.2%, a difference of 1.3%), Carpatho Rusyn (25.2%, a difference of 1.3%), Pueblo (25.2%, a difference of 1.5%), Hopi (25.2%, a difference of 1.6%), and Alsatian (25.3%, a difference of 1.8%).
| Demographics | Rating | Rank | Family Households with Children |
| Immigrants | Switzerland | 0.0 /100 | #333 | Tragic 25.7% |
| Slovaks | 0.0 /100 | #334 | Tragic 25.7% |
| Immigrants | Croatia | 0.0 /100 | #335 | Tragic 25.7% |
| Immigrants | West Indies | 0.0 /100 | #336 | Tragic 25.7% |
| Puerto Ricans | 0.0 /100 | #337 | Tragic 25.6% |
| Arapaho | 0.0 /100 | #338 | Tragic 25.6% |
| Immigrants | St. Vincent and the Grenadines | 0.0 /100 | #339 | Tragic 25.6% |
| Immigrants | Armenia | 0.0 /100 | #340 | Tragic 25.6% |
| Immigrants | Serbia | 0.0 /100 | #341 | Tragic 25.5% |
| Alsatians | 0.0 /100 | #342 | Tragic 25.3% |
| Hopi | 0.0 /100 | #343 | Tragic 25.2% |
| Pueblo | 0.0 /100 | #344 | Tragic 25.2% |
| Immigrants | Grenada | 0.0 /100 | #345 | Tragic 25.2% |
| Carpatho Rusyns | 0.0 /100 | #346 | Tragic 25.2% |
| Soviet Union | 0.0 /100 | #347 | Tragic 24.8% |