Yaqui vs Swedish Divorced or Separated
COMPARE
Yaqui
Swedish
Divorced or Separated
Divorced or Separated Comparison
Yaqui
Swedes
13.3%
DIVORCED OR SEPARATED
0.0/ 100
METRIC RATING
314th/ 347
METRIC RANK
12.1%
DIVORCED OR SEPARATED
34.4/ 100
METRIC RATING
191st/ 347
METRIC RANK
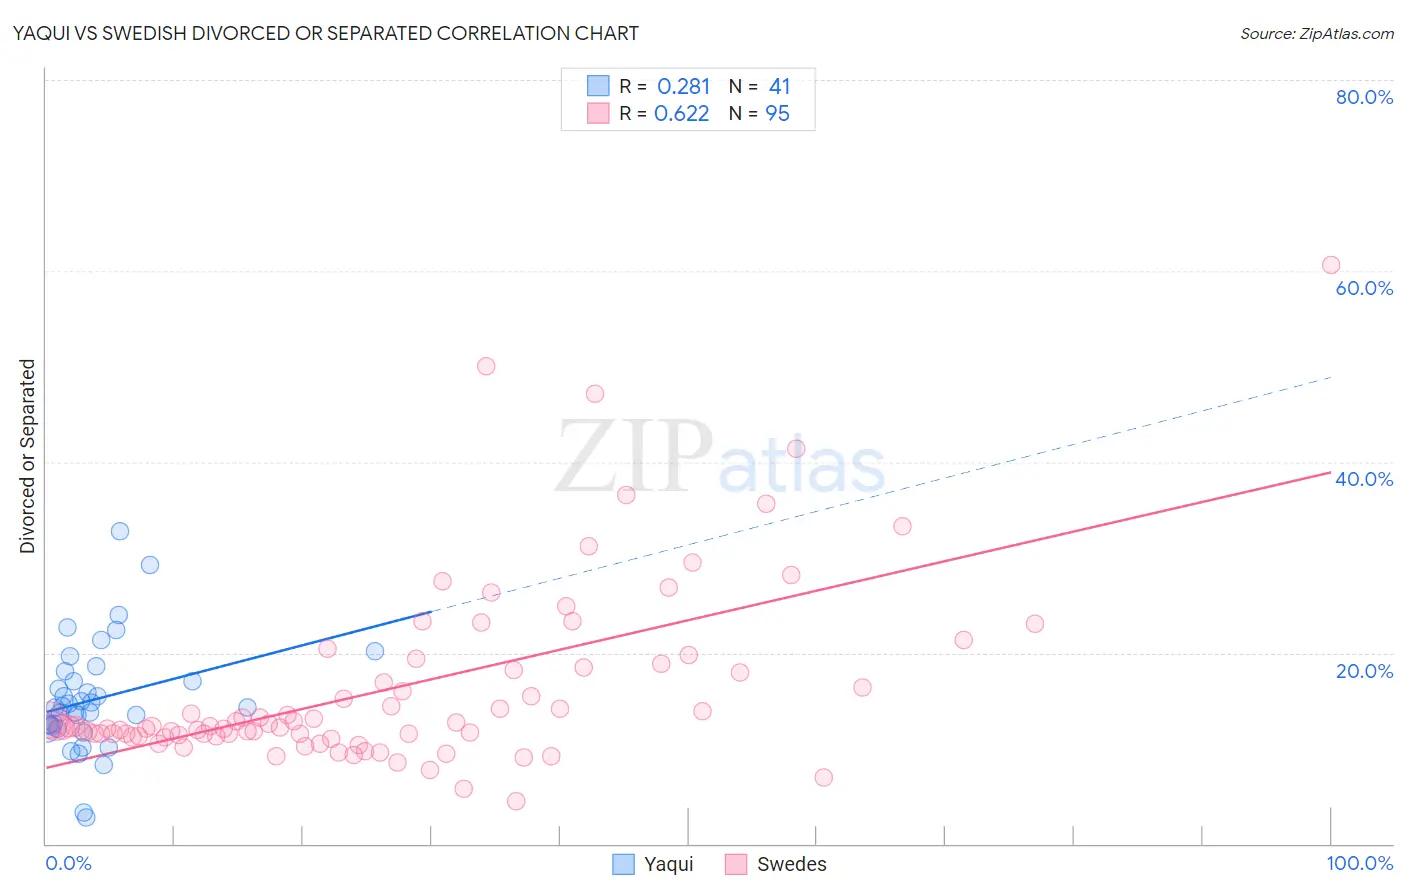
Yaqui vs Swedish Divorced or Separated Correlation Chart
The statistical analysis conducted on geographies consisting of 107,734,723 people shows a weak positive correlation between the proportion of Yaqui and percentage of population currently divorced or separated in the United States with a correlation coefficient (R) of 0.281 and weighted average of 13.3%. Similarly, the statistical analysis conducted on geographies consisting of 538,888,854 people shows a significant positive correlation between the proportion of Swedes and percentage of population currently divorced or separated in the United States with a correlation coefficient (R) of 0.622 and weighted average of 12.1%, a difference of 9.8%.
Divorced or Separated Correlation Summary
| Measurement | Yaqui | Swedish |
| Minimum | 2.8% | 4.5% |
| Maximum | 32.7% | 60.6% |
| Range | 29.9% | 56.1% |
| Mean | 15.1% | 16.3% |
| Median | 14.3% | 12.3% |
| Interquartile 25% (IQ1) | 12.2% | 11.4% |
| Interquartile 75% (IQ3) | 17.5% | 18.5% |
| Interquartile Range (IQR) | 5.4% | 7.2% |
| Standard Deviation (Sample) | 5.8% | 9.7% |
| Standard Deviation (Population) | 5.7% | 9.6% |
Similar Demographics by Divorced or Separated
Demographics Similar to Yaqui by Divorced or Separated
In terms of divorced or separated, the demographic groups most similar to Yaqui are Immigrants from Nicaragua (13.3%, a difference of 0.010%), Blackfeet (13.3%, a difference of 0.21%), Spanish American (13.3%, a difference of 0.23%), Tsimshian (13.3%, a difference of 0.26%), and Haitian (13.3%, a difference of 0.28%).
| Demographics | Rating | Rank | Divorced or Separated |
| French American Indians | 0.0 /100 | #307 | Tragic 13.2% |
| Ottawa | 0.0 /100 | #308 | Tragic 13.2% |
| Americans | 0.0 /100 | #309 | Tragic 13.2% |
| Africans | 0.0 /100 | #310 | Tragic 13.2% |
| Sioux | 0.0 /100 | #311 | Tragic 13.2% |
| Blackfeet | 0.0 /100 | #312 | Tragic 13.3% |
| Immigrants | Nicaragua | 0.0 /100 | #313 | Tragic 13.3% |
| Yaqui | 0.0 /100 | #314 | Tragic 13.3% |
| Spanish Americans | 0.0 /100 | #315 | Tragic 13.3% |
| Tsimshian | 0.0 /100 | #316 | Tragic 13.3% |
| Haitians | 0.0 /100 | #317 | Tragic 13.3% |
| Cree | 0.0 /100 | #318 | Tragic 13.4% |
| Puget Sound Salish | 0.0 /100 | #319 | Tragic 13.4% |
| Cajuns | 0.0 /100 | #320 | Tragic 13.4% |
| Cheyenne | 0.0 /100 | #321 | Tragic 13.4% |
Demographics Similar to Swedes by Divorced or Separated
In terms of divorced or separated, the demographic groups most similar to Swedes are Moroccan (12.1%, a difference of 0.020%), Sierra Leonean (12.1%, a difference of 0.040%), Norwegian (12.1%, a difference of 0.050%), Immigrants from Thailand (12.1%, a difference of 0.070%), and Immigrants from Eritrea (12.1%, a difference of 0.10%).
| Demographics | Rating | Rank | Divorced or Separated |
| Immigrants | North America | 41.1 /100 | #184 | Average 12.1% |
| Immigrants | Nigeria | 40.5 /100 | #185 | Average 12.1% |
| Immigrants | Chile | 39.0 /100 | #186 | Fair 12.1% |
| Belizeans | 37.7 /100 | #187 | Fair 12.1% |
| Immigrants | Belize | 37.6 /100 | #188 | Fair 12.1% |
| Sierra Leoneans | 35.5 /100 | #189 | Fair 12.1% |
| Moroccans | 34.8 /100 | #190 | Fair 12.1% |
| Swedes | 34.4 /100 | #191 | Fair 12.1% |
| Norwegians | 33.2 /100 | #192 | Fair 12.1% |
| Immigrants | Thailand | 32.5 /100 | #193 | Fair 12.1% |
| Immigrants | Eritrea | 31.9 /100 | #194 | Fair 12.1% |
| Immigrants | England | 31.4 /100 | #195 | Fair 12.1% |
| Immigrants | Burma/Myanmar | 30.4 /100 | #196 | Fair 12.1% |
| Immigrants | Africa | 30.3 /100 | #197 | Fair 12.1% |
| Nigerians | 30.1 /100 | #198 | Fair 12.1% |