Lady Lake, FL Map & Demographics
Lady Lake Map
Lady Lake Overview
$32,383
PER CAPITA INCOME
$62,027
AVG FAMILY INCOME
$46,694
AVG HOUSEHOLD INCOME
37.6%
WAGE / INCOME GAP [ % ]
62.4¢/ $1
WAGE / INCOME GAP [ $ ]
$19,006
FAMILY INCOME DEFICIT
0.40
INEQUALITY / GINI INDEX
16,047
TOTAL POPULATION
7,371
MALE POPULATION
8,676
FEMALE POPULATION
84.96
MALES / 100 FEMALES
117.70
FEMALES / 100 MALES
65.5
MEDIAN AGE
2.4
AVG FAMILY SIZE
1.9
AVG HOUSEHOLD SIZE
5,099
LABOR FORCE [ PEOPLE ]
35.1%
PERCENT IN LABOR FORCE
7.7%
UNEMPLOYMENT RATE
Lady Lake Zip Codes
Lady Lake Area Codes
Income in Lady Lake
Income Overview in Lady Lake
Per Capita Income in Lady Lake is $32,383, while median incomes of families and households are $62,027 and $46,694 respectively.
| Characteristic | Number | Measure |
| Per Capita Income | 16,047 | $32,383 |
| Median Family Income | 4,674 | $62,027 |
| Mean Family Income | 4,674 | $72,985 |
| Median Household Income | 8,250 | $46,694 |
| Mean Household Income | 8,250 | $62,091 |
| Income Deficit | 4,674 | $19,006 |
| Wage / Income Gap (%) | 16,047 | 37.62% |
| Wage / Income Gap ($) | 16,047 | 62.38¢ per $1 |
| Gini / Inequality Index | 16,047 | 0.40 |
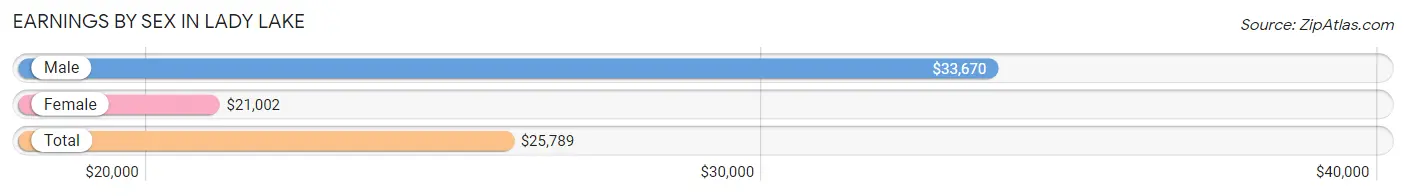
Earnings by Sex in Lady Lake
Average Earnings in Lady Lake are $25,789, $33,670 for men and $21,002 for women, a difference of 37.6%.
| Sex | Number | Average Earnings |
| Male | 2,457 (42.5%) | $33,670 |
| Female | 3,319 (57.5%) | $21,002 |
| Total | 5,776 (100.0%) | $25,789 |
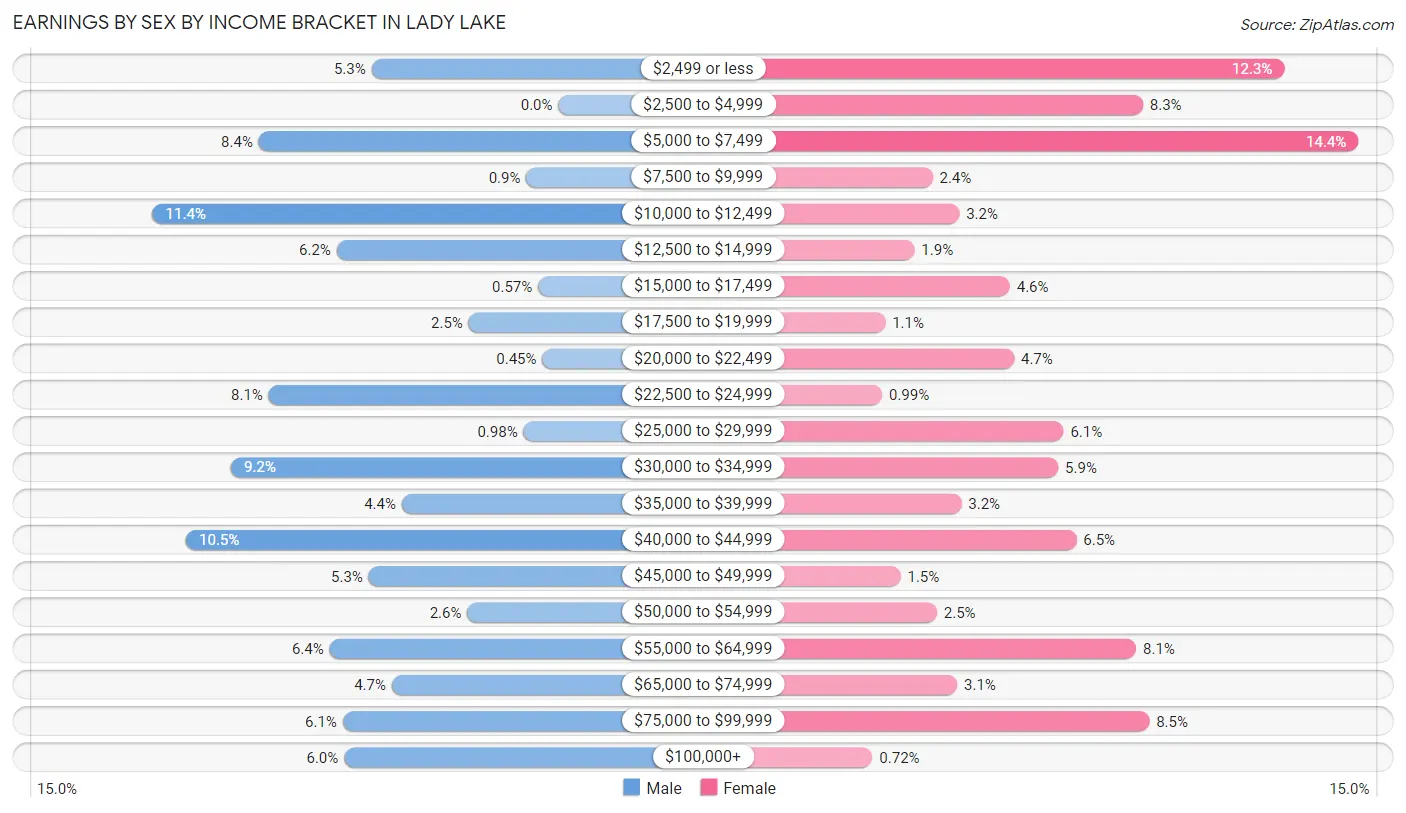
Earnings by Sex by Income Bracket in Lady Lake
The most common earnings brackets in Lady Lake are $10,000 to $12,499 for men (280 | 11.4%) and $5,000 to $7,499 for women (477 | 14.4%).
| Income | Male | Female |
| $2,499 or less | 129 (5.2%) | 408 (12.3%) |
| $2,500 to $4,999 | 0 (0.0%) | 276 (8.3%) |
| $5,000 to $7,499 | 207 (8.4%) | 477 (14.4%) |
| $7,500 to $9,999 | 22 (0.9%) | 80 (2.4%) |
| $10,000 to $12,499 | 280 (11.4%) | 105 (3.2%) |
| $12,500 to $14,999 | 153 (6.2%) | 63 (1.9%) |
| $15,000 to $17,499 | 14 (0.6%) | 152 (4.6%) |
| $17,500 to $19,999 | 62 (2.5%) | 36 (1.1%) |
| $20,000 to $22,499 | 11 (0.4%) | 156 (4.7%) |
| $22,500 to $24,999 | 200 (8.1%) | 33 (1.0%) |
| $25,000 to $29,999 | 24 (1.0%) | 202 (6.1%) |
| $30,000 to $34,999 | 226 (9.2%) | 197 (5.9%) |
| $35,000 to $39,999 | 108 (4.4%) | 107 (3.2%) |
| $40,000 to $44,999 | 257 (10.5%) | 214 (6.5%) |
| $45,000 to $49,999 | 131 (5.3%) | 50 (1.5%) |
| $50,000 to $54,999 | 63 (2.6%) | 84 (2.5%) |
| $55,000 to $64,999 | 158 (6.4%) | 270 (8.1%) |
| $65,000 to $74,999 | 115 (4.7%) | 103 (3.1%) |
| $75,000 to $99,999 | 149 (6.1%) | 282 (8.5%) |
| $100,000+ | 148 (6.0%) | 24 (0.7%) |
| Total | 2,457 (100.0%) | 3,319 (100.0%) |
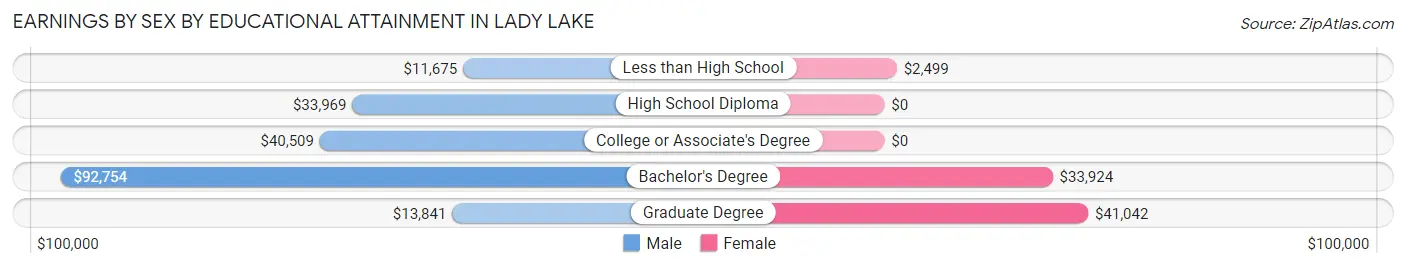
Earnings by Sex by Educational Attainment in Lady Lake
Average earnings in Lady Lake are $34,481 for men and $21,292 for women, a difference of 38.3%. Men with an educational attainment of bachelor's degree enjoy the highest average annual earnings of $92,754, while those with less than high school education earn the least with $11,675. Women with an educational attainment of graduate degree earn the most with the average annual earnings of $41,042, while those with less than high school education have the smallest earnings of $2,499.
| Educational Attainment | Male Income | Female Income |
| Less than High School | $11,675 | $2,499 |
| High School Diploma | $33,969 | $0 |
| College or Associate's Degree | $40,509 | $0 |
| Bachelor's Degree | $92,754 | $33,924 |
| Graduate Degree | $13,841 | $41,042 |
| Total | $34,481 | $21,292 |
Family Income in Lady Lake
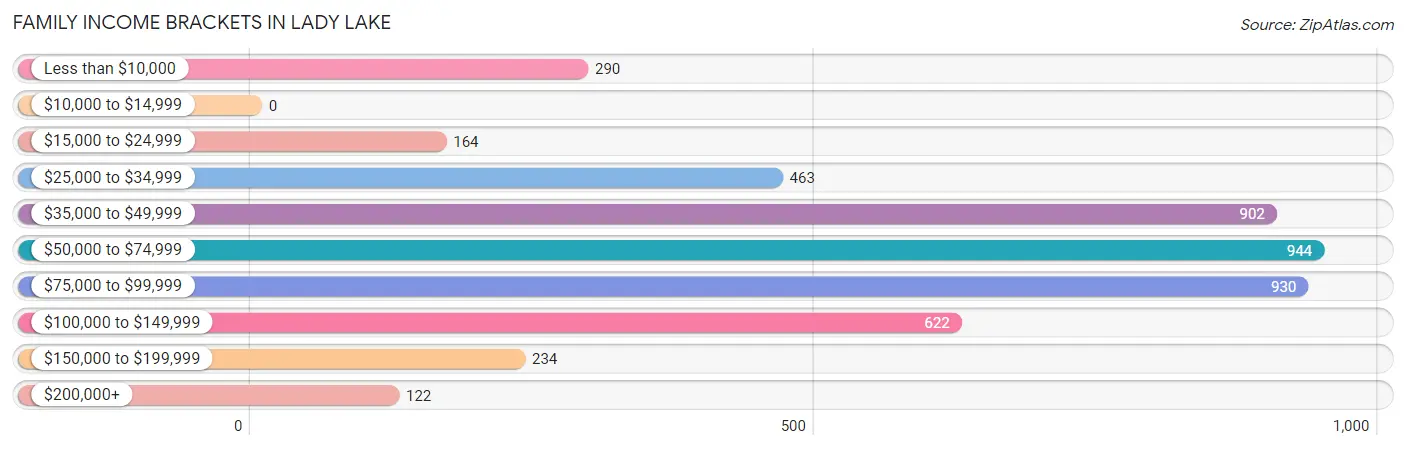
Family Income Brackets in Lady Lake
According to the Lady Lake family income data, there are 944 families falling into the $50,000 to $74,999 income range, which is the most common income bracket and makes up 20.2% of all families.
| Income Bracket | # Families | % Families |
| Less than $10,000 | 290 | 6.2% |
| $10,000 to $14,999 | 0 | 0.0% |
| $15,000 to $24,999 | 164 | 3.5% |
| $25,000 to $34,999 | 463 | 9.9% |
| $35,000 to $49,999 | 902 | 19.3% |
| $50,000 to $74,999 | 944 | 20.2% |
| $75,000 to $99,999 | 930 | 19.9% |
| $100,000 to $149,999 | 622 | 13.3% |
| $150,000 to $199,999 | 234 | 5.0% |
| $200,000+ | 122 | 2.6% |
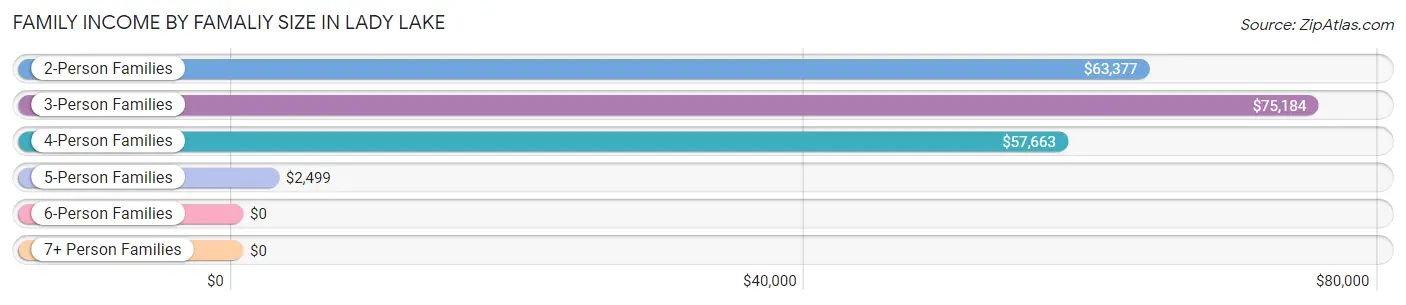
Family Income by Famaliy Size in Lady Lake
3-person families (535 | 11.5%) account for the highest median family income in Lady Lake with $75,184 per family, while 2-person families (3,722 | 79.6%) have the highest median income of $31,688 per family member.
| Income Bracket | # Families | Median Income |
| 2-Person Families | 3,722 (79.6%) | $63,377 |
| 3-Person Families | 535 (11.5%) | $75,184 |
| 4-Person Families | 171 (3.7%) | $57,663 |
| 5-Person Families | 151 (3.2%) | $2,499 |
| 6-Person Families | 95 (2.0%) | $0 |
| 7+ Person Families | 0 (0.0%) | $0 |
| Total | 4,674 (100.0%) | $62,027 |
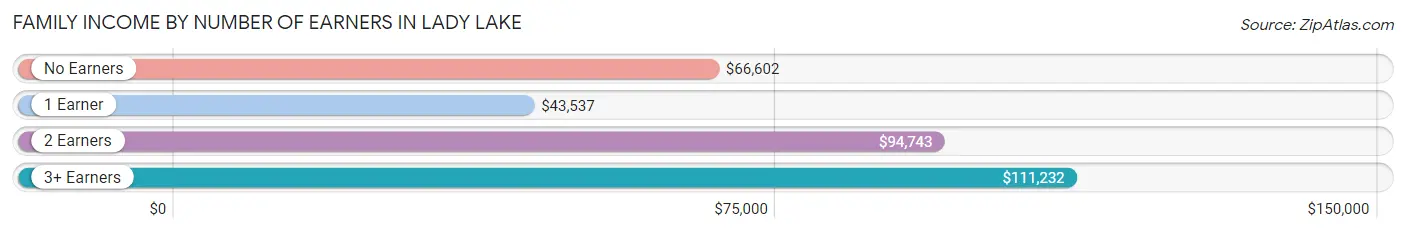
Family Income by Number of Earners in Lady Lake
The median family income in Lady Lake is $62,027, with families comprising 3+ earners (245) having the highest median family income of $111,232, while families with 1 earner (1,577) have the lowest median family income of $43,537, accounting for 5.2% and 33.7% of families, respectively.
| Number of Earners | # Families | Median Income |
| No Earners | 2,128 (45.5%) | $66,602 |
| 1 Earner | 1,577 (33.7%) | $43,537 |
| 2 Earners | 724 (15.5%) | $94,743 |
| 3+ Earners | 245 (5.2%) | $111,232 |
| Total | 4,674 (100.0%) | $62,027 |
Household Income in Lady Lake
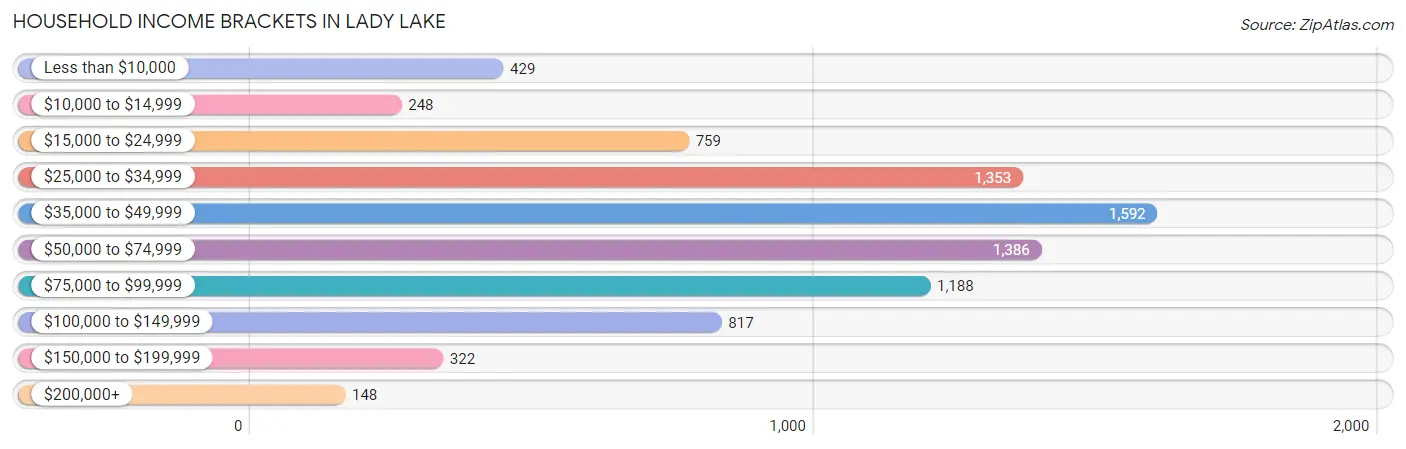
Household Income Brackets in Lady Lake
With 1,592 households falling in the category, the $35,000 to $49,999 income range is the most frequent in Lady Lake, accounting for 19.3% of all households. In contrast, only 148 households (1.8%) fall into the $200,000+ income bracket, making it the least populous group.
| Income Bracket | # Households | % Households |
| Less than $10,000 | 429 | 5.2% |
| $10,000 to $14,999 | 248 | 3.0% |
| $15,000 to $24,999 | 759 | 9.2% |
| $25,000 to $34,999 | 1,353 | 16.4% |
| $35,000 to $49,999 | 1,592 | 19.3% |
| $50,000 to $74,999 | 1,386 | 16.8% |
| $75,000 to $99,999 | 1,188 | 14.4% |
| $100,000 to $149,999 | 817 | 9.9% |
| $150,000 to $199,999 | 322 | 3.9% |
| $200,000+ | 148 | 1.8% |
Household Income by Householder Age in Lady Lake
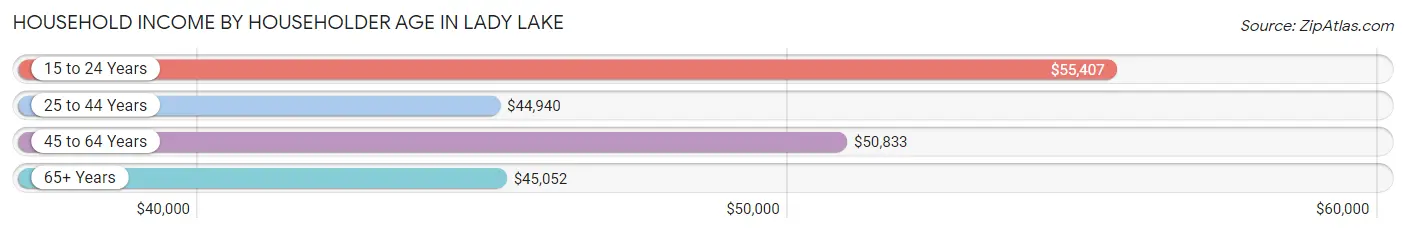
The median household income in Lady Lake is $46,694, with the highest median household income of $55,407 found in the 15 to 24 years age bracket for the primary householder. A total of 228 households (2.8%) fall into this category. Meanwhile, the 25 to 44 years age bracket for the primary householder has the lowest median household income of $44,940, with 974 households (11.8%) in this group.
| Income Bracket | # Households | Median Income |
| 15 to 24 Years | 228 (2.8%) | $55,407 |
| 25 to 44 Years | 974 (11.8%) | $44,940 |
| 45 to 64 Years | 2,112 (25.6%) | $50,833 |
| 65+ Years | 4,936 (59.8%) | $45,052 |
| Total | 8,250 (100.0%) | $46,694 |
Poverty in Lady Lake
Income Below Poverty by Sex and Age in Lady Lake
With 13.5% poverty level for males and 14.3% for females among the residents of Lady Lake, under 5 year old males and under 5 year old females are the most vulnerable to poverty, with 247 males (93.9%) and 80 females (72.7%) in their respective age groups living below the poverty level.
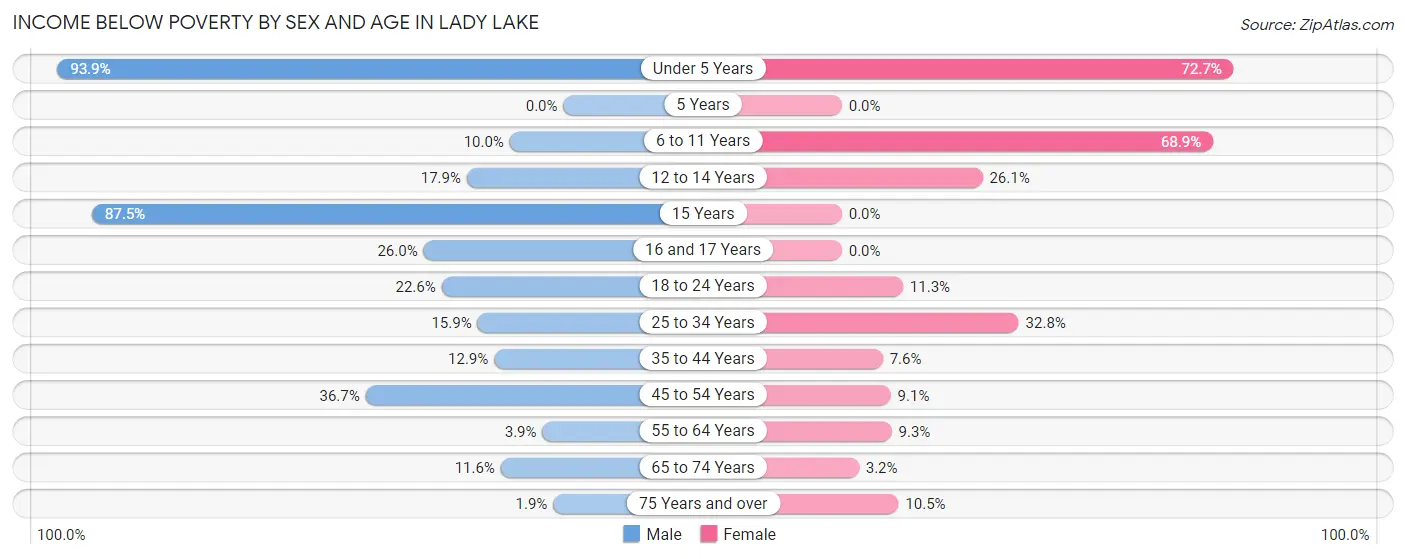
| Age Bracket | Male | Female |
| Under 5 Years | 247 (93.9%) | 80 (72.7%) |
| 5 Years | 0 (0.0%) | 0 (0.0%) |
| 6 to 11 Years | 28 (10.0%) | 306 (68.9%) |
| 12 to 14 Years | 19 (17.9%) | 41 (26.1%) |
| 15 Years | 49 (87.5%) | 0 (0.0%) |
| 16 and 17 Years | 27 (26.0%) | 0 (0.0%) |
| 18 to 24 Years | 45 (22.6%) | 56 (11.3%) |
| 25 to 34 Years | 73 (15.9%) | 238 (32.8%) |
| 35 to 44 Years | 51 (12.9%) | 39 (7.6%) |
| 45 to 54 Years | 185 (36.7%) | 34 (9.1%) |
| 55 to 64 Years | 42 (3.9%) | 130 (9.2%) |
| 65 to 74 Years | 178 (11.6%) | 61 (3.2%) |
| 75 Years and over | 43 (1.9%) | 235 (10.5%) |
| Total | 987 (13.5%) | 1,220 (14.3%) |
Income Above Poverty by Sex and Age in Lady Lake
According to the poverty statistics in Lady Lake, males aged 5 years and females aged 15 years are the age groups that are most secure financially, with 100.0% of males and 100.0% of females in these age groups living above the poverty line.
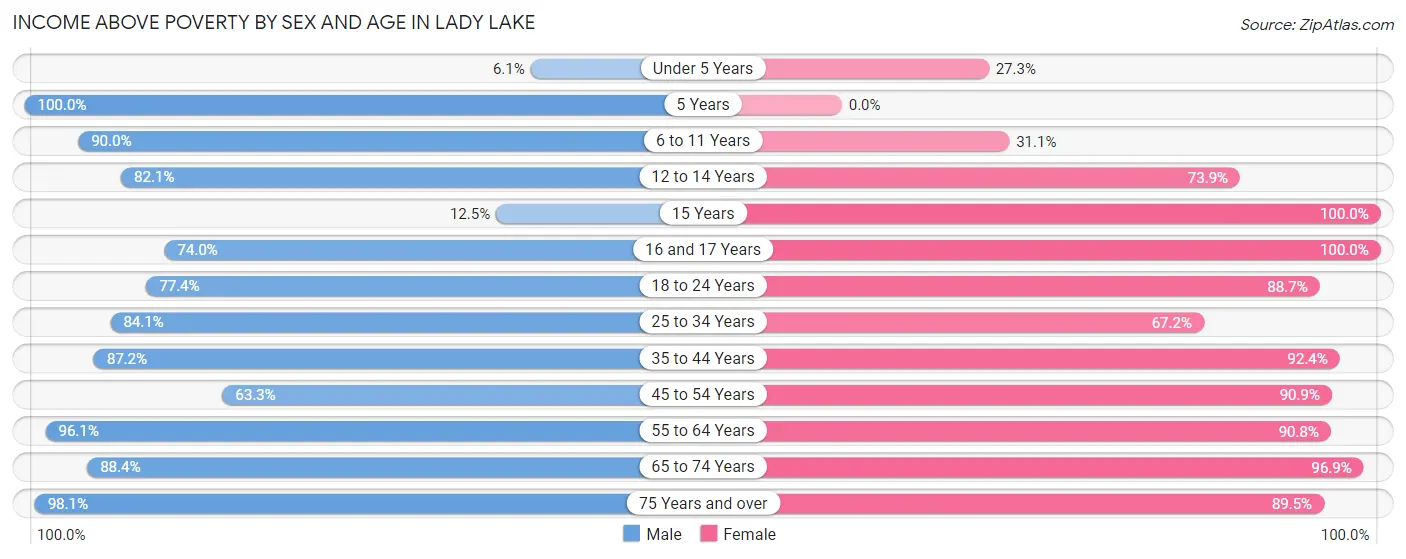
| Age Bracket | Male | Female |
| Under 5 Years | 16 (6.1%) | 30 (27.3%) |
| 5 Years | 33 (100.0%) | 0 (0.0%) |
| 6 to 11 Years | 253 (90.0%) | 138 (31.1%) |
| 12 to 14 Years | 87 (82.1%) | 116 (73.9%) |
| 15 Years | 7 (12.5%) | 69 (100.0%) |
| 16 and 17 Years | 77 (74.0%) | 65 (100.0%) |
| 18 to 24 Years | 154 (77.4%) | 438 (88.7%) |
| 25 to 34 Years | 385 (84.1%) | 487 (67.2%) |
| 35 to 44 Years | 346 (87.2%) | 474 (92.4%) |
| 45 to 54 Years | 319 (63.3%) | 341 (90.9%) |
| 55 to 64 Years | 1,039 (96.1%) | 1,276 (90.7%) |
| 65 to 74 Years | 1,352 (88.4%) | 1,877 (96.9%) |
| 75 Years and over | 2,238 (98.1%) | 2,000 (89.5%) |
| Total | 6,306 (86.5%) | 7,311 (85.7%) |
Income Below Poverty Among Married-Couple Families in Lady Lake
The poverty statistics for married-couple families in Lady Lake show that 0.8% or 30 of the total 3,624 families live below the poverty line. Families with no children have the highest poverty rate of 0.9%, comprising of 30 families. On the other hand, families with 1 or 2 children have the lowest poverty rate of 0.0%, which includes 0 families.
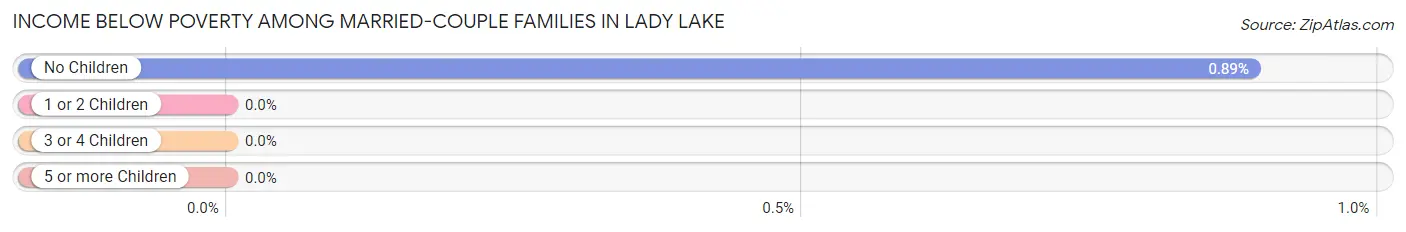
| Children | Above Poverty | Below Poverty |
| No Children | 3,351 (99.1%) | 30 (0.9%) |
| 1 or 2 Children | 129 (100.0%) | 0 (0.0%) |
| 3 or 4 Children | 114 (100.0%) | 0 (0.0%) |
| 5 or more Children | 0 (0.0%) | 0 (0.0%) |
| Total | 3,594 (99.2%) | 30 (0.8%) |
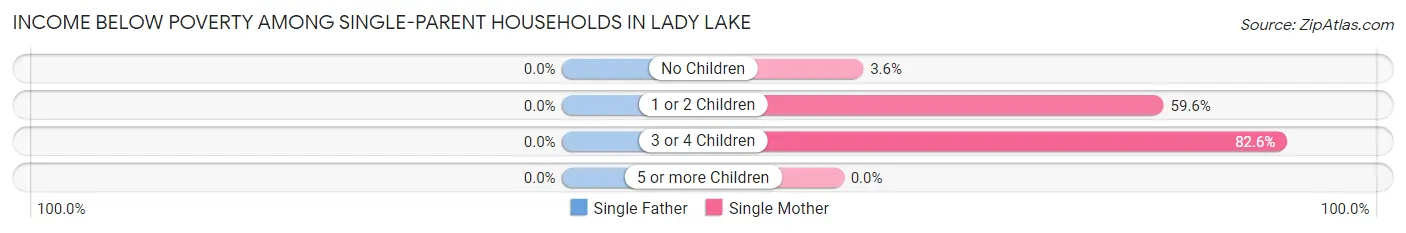
Income Below Poverty Among Single-Parent Households in Lady Lake
| Children | Single Father | Single Mother |
| No Children | 0 (0.0%) | 17 (3.6%) |
| 1 or 2 Children | 0 (0.0%) | 174 (59.6%) |
| 3 or 4 Children | 0 (0.0%) | 114 (82.6%) |
| 5 or more Children | 0 (0.0%) | 0 (0.0%) |
| Total | 0 (0.0%) | 305 (34.0%) |
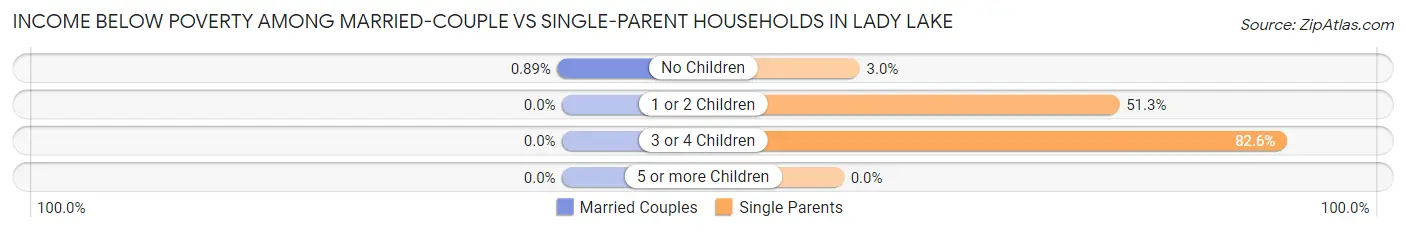
Income Below Poverty Among Married-Couple vs Single-Parent Households in Lady Lake
The poverty data for Lady Lake shows that 30 of the married-couple family households (0.8%) and 305 of the single-parent households (29.0%) are living below the poverty level. Within the married-couple family households, those with no children have the highest poverty rate, with 30 households (0.9%) falling below the poverty line. Among the single-parent households, those with 3 or 4 children have the highest poverty rate, with 114 household (82.6%) living below poverty.
| Children | Married-Couple Families | Single-Parent Households |
| No Children | 30 (0.9%) | 17 (3.0%) |
| 1 or 2 Children | 0 (0.0%) | 174 (51.3%) |
| 3 or 4 Children | 0 (0.0%) | 114 (82.6%) |
| 5 or more Children | 0 (0.0%) | 0 (0.0%) |
| Total | 30 (0.8%) | 305 (29.0%) |
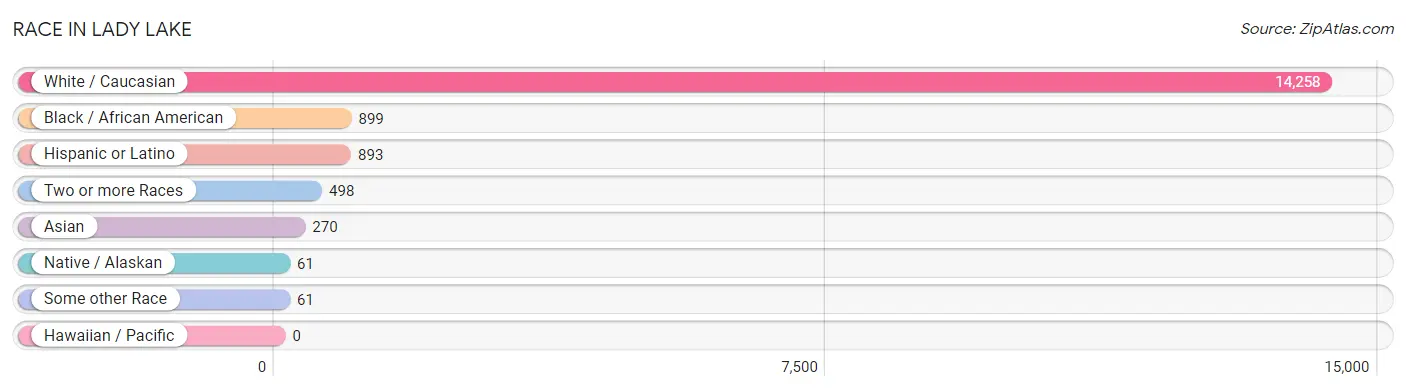
Race in Lady Lake
The most populous races in Lady Lake are White / Caucasian (14,258 | 88.8%), Black / African American (899 | 5.6%), and Hispanic or Latino (893 | 5.6%).
| Race | # Population | % Population |
| Asian | 270 | 1.7% |
| Black / African American | 899 | 5.6% |
| Hawaiian / Pacific | 0 | 0.0% |
| Hispanic or Latino | 893 | 5.6% |
| Native / Alaskan | 61 | 0.4% |
| White / Caucasian | 14,258 | 88.8% |
| Two or more Races | 498 | 3.1% |
| Some other Race | 61 | 0.4% |
| Total | 16,047 | 100.0% |
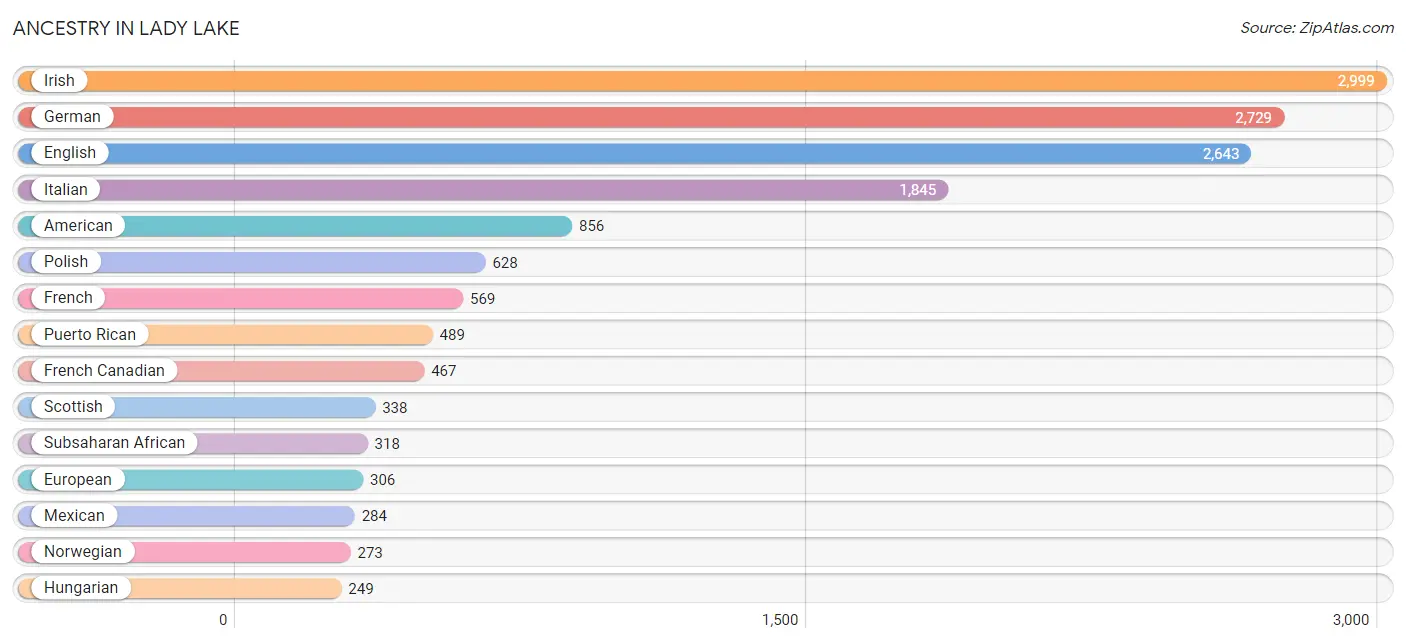
Ancestry in Lady Lake
The most populous ancestries reported in Lady Lake are Irish (2,999 | 18.7%), German (2,729 | 17.0%), English (2,643 | 16.5%), Italian (1,845 | 11.5%), and American (856 | 5.3%), together accounting for 69.0% of all Lady Lake residents.
| Ancestry | # Population | % Population |
| African | 243 | 1.5% |
| American | 856 | 5.3% |
| Arab | 104 | 0.6% |
| Australian | 33 | 0.2% |
| Austrian | 52 | 0.3% |
| Basque | 17 | 0.1% |
| Belgian | 56 | 0.4% |
| Bhutanese | 44 | 0.3% |
| Blackfeet | 10 | 0.1% |
| British | 160 | 1.0% |
| Canadian | 52 | 0.3% |
| Cherokee | 71 | 0.4% |
| Colombian | 34 | 0.2% |
| Croatian | 94 | 0.6% |
| Cuban | 62 | 0.4% |
| Czech | 54 | 0.3% |
| Danish | 100 | 0.6% |
| Dutch | 87 | 0.5% |
| English | 2,643 | 16.5% |
| European | 306 | 1.9% |
| Finnish | 10 | 0.1% |
| French | 569 | 3.5% |
| French Canadian | 467 | 2.9% |
| German | 2,729 | 17.0% |
| Greek | 38 | 0.2% |
| Hungarian | 249 | 1.5% |
| Indian (Asian) | 37 | 0.2% |
| Irish | 2,999 | 18.7% |
| Italian | 1,845 | 11.5% |
| Jamaican | 4 | 0.0% |
| Lebanese | 81 | 0.5% |
| Lithuanian | 8 | 0.1% |
| Mexican | 284 | 1.8% |
| Nigerian | 51 | 0.3% |
| Norwegian | 273 | 1.7% |
| Polish | 628 | 3.9% |
| Portuguese | 45 | 0.3% |
| Puerto Rican | 489 | 3.0% |
| Russian | 34 | 0.2% |
| Scandinavian | 10 | 0.1% |
| Scotch-Irish | 161 | 1.0% |
| Scottish | 338 | 2.1% |
| Serbian | 14 | 0.1% |
| Slavic | 7 | 0.0% |
| Slovak | 10 | 0.1% |
| South American | 34 | 0.2% |
| Sri Lankan | 236 | 1.5% |
| Subsaharan African | 318 | 2.0% |
| Swedish | 120 | 0.7% |
| Swiss | 96 | 0.6% |
| Syrian | 8 | 0.1% |
| Ukrainian | 115 | 0.7% |
| Welsh | 74 | 0.5% |
| Zimbabwean | 24 | 0.2% | View All 54 Rows |
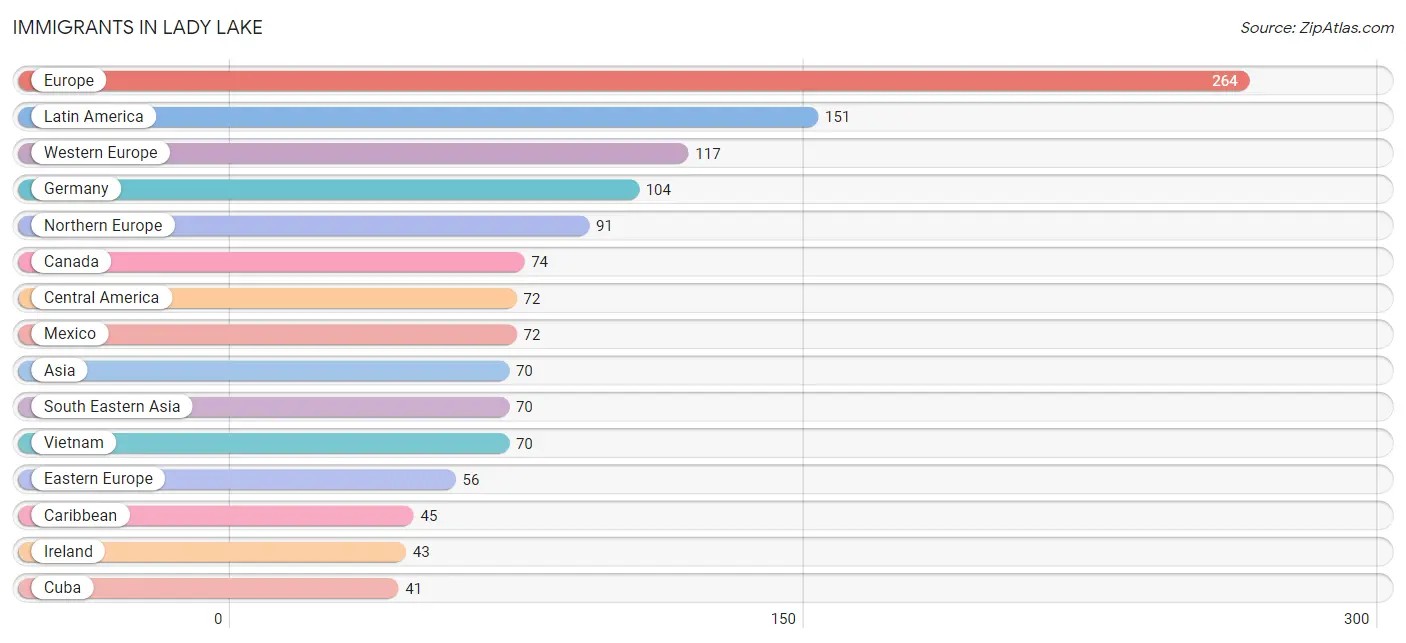
Immigrants in Lady Lake
The most numerous immigrant groups reported in Lady Lake came from Europe (264 | 1.7%), Latin America (151 | 0.9%), Western Europe (117 | 0.7%), Germany (104 | 0.6%), and Northern Europe (91 | 0.6%), together accounting for 4.5% of all Lady Lake residents.
| Immigration Origin | # Population | % Population |
| Africa | 36 | 0.2% |
| Asia | 70 | 0.4% |
| Canada | 74 | 0.5% |
| Caribbean | 45 | 0.3% |
| Central America | 72 | 0.4% |
| Colombia | 34 | 0.2% |
| Croatia | 13 | 0.1% |
| Cuba | 41 | 0.3% |
| Eastern Africa | 24 | 0.2% |
| Eastern Europe | 56 | 0.4% |
| England | 13 | 0.1% |
| Europe | 264 | 1.7% |
| Germany | 104 | 0.6% |
| Hungary | 8 | 0.1% |
| Ireland | 43 | 0.3% |
| Jamaica | 4 | 0.0% |
| Latin America | 151 | 0.9% |
| Mexico | 72 | 0.4% |
| Northern Europe | 91 | 0.6% |
| South Africa | 12 | 0.1% |
| South America | 34 | 0.2% |
| South Eastern Asia | 70 | 0.4% |
| Switzerland | 13 | 0.1% |
| Ukraine | 35 | 0.2% |
| Vietnam | 70 | 0.4% |
| Western Europe | 117 | 0.7% |
| Zimbabwe | 24 | 0.2% | View All 27 Rows |
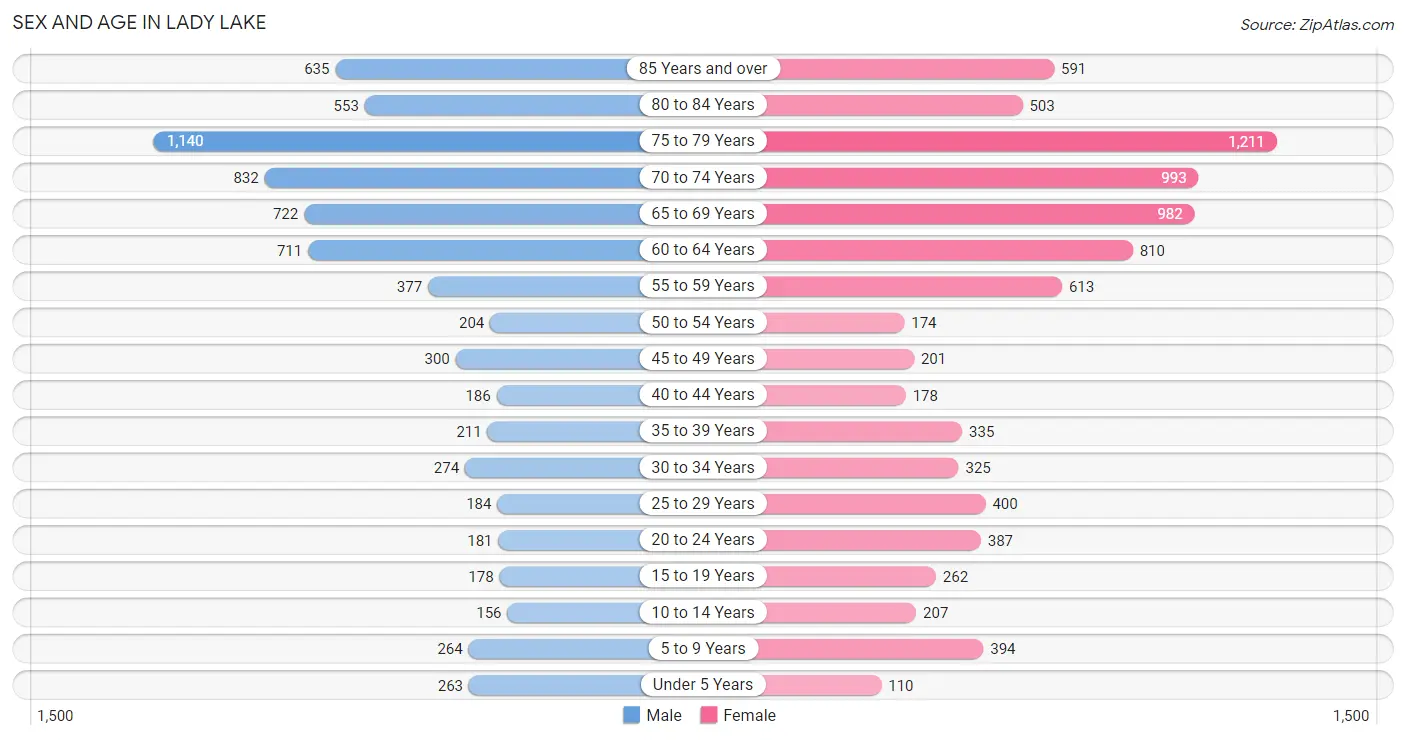
Sex and Age in Lady Lake
Sex and Age in Lady Lake
The most populous age groups in Lady Lake are 75 to 79 Years (1,140 | 15.5%) for men and 75 to 79 Years (1,211 | 14.0%) for women.
| Age Bracket | Male | Female |
| Under 5 Years | 263 (3.6%) | 110 (1.3%) |
| 5 to 9 Years | 264 (3.6%) | 394 (4.5%) |
| 10 to 14 Years | 156 (2.1%) | 207 (2.4%) |
| 15 to 19 Years | 178 (2.4%) | 262 (3.0%) |
| 20 to 24 Years | 181 (2.5%) | 387 (4.5%) |
| 25 to 29 Years | 184 (2.5%) | 400 (4.6%) |
| 30 to 34 Years | 274 (3.7%) | 325 (3.7%) |
| 35 to 39 Years | 211 (2.9%) | 335 (3.9%) |
| 40 to 44 Years | 186 (2.5%) | 178 (2.1%) |
| 45 to 49 Years | 300 (4.1%) | 201 (2.3%) |
| 50 to 54 Years | 204 (2.8%) | 174 (2.0%) |
| 55 to 59 Years | 377 (5.1%) | 613 (7.1%) |
| 60 to 64 Years | 711 (9.7%) | 810 (9.3%) |
| 65 to 69 Years | 722 (9.8%) | 982 (11.3%) |
| 70 to 74 Years | 832 (11.3%) | 993 (11.5%) |
| 75 to 79 Years | 1,140 (15.5%) | 1,211 (14.0%) |
| 80 to 84 Years | 553 (7.5%) | 503 (5.8%) |
| 85 Years and over | 635 (8.6%) | 591 (6.8%) |
| Total | 7,371 (100.0%) | 8,676 (100.0%) |
Families and Households in Lady Lake
Median Family Size in Lady Lake
The median family size in Lady Lake is 2.41 persons per family, with single female/mother families (897 | 19.2%) accounting for the largest median family size of 3.1 persons per family. On the other hand, married-couple families (3,624 | 77.5%) represent the smallest median family size with 2.23 persons per family.

| Family Type | # Families | Family Size |
| Married-Couple | 3,624 (77.5%) | 2.23 |
| Single Male/Father | 153 (3.3%) | 2.76 |
| Single Female/Mother | 897 (19.2%) | 3.10 |
| Total Families | 4,674 (100.0%) | 2.41 |
Median Household Size in Lady Lake
The median household size in Lady Lake is 1.92 persons per household, with single female/mother households (897 | 10.9%) accounting for the largest median household size of 3.38 persons per household. non-family households (3,576 | 43.3%) represent the smallest median household size with 1.19 persons per household.

| Household Type | # Households | Household Size |
| Married-Couple | 3,624 (43.9%) | 2.23 |
| Single Male/Father | 153 (1.8%) | 2.96 |
| Single Female/Mother | 897 (10.9%) | 3.38 |
| Non-family | 3,576 (43.3%) | 1.19 |
| Total Households | 8,250 (100.0%) | 1.92 |
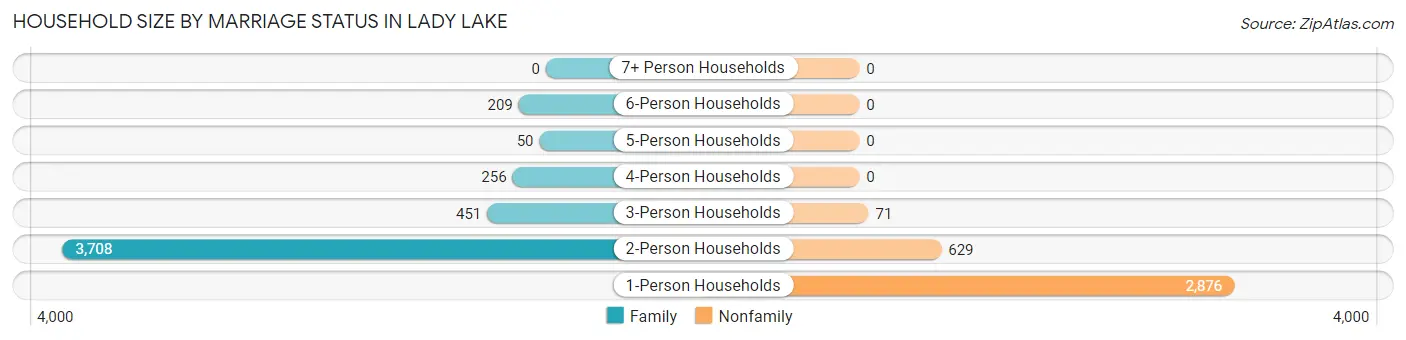
Household Size by Marriage Status in Lady Lake
Out of a total of 8,250 households in Lady Lake, 4,674 (56.7%) are family households, while 3,576 (43.3%) are nonfamily households. The most numerous type of family households are 2-person households, comprising 3,708, and the most common type of nonfamily households are 1-person households, comprising 2,876.
| Household Size | Family Households | Nonfamily Households |
| 1-Person Households | - | 2,876 (34.9%) |
| 2-Person Households | 3,708 (45.0%) | 629 (7.6%) |
| 3-Person Households | 451 (5.5%) | 71 (0.9%) |
| 4-Person Households | 256 (3.1%) | 0 (0.0%) |
| 5-Person Households | 50 (0.6%) | 0 (0.0%) |
| 6-Person Households | 209 (2.5%) | 0 (0.0%) |
| 7+ Person Households | 0 (0.0%) | 0 (0.0%) |
| Total | 4,674 (56.7%) | 3,576 (43.3%) |
Female Fertility in Lady Lake
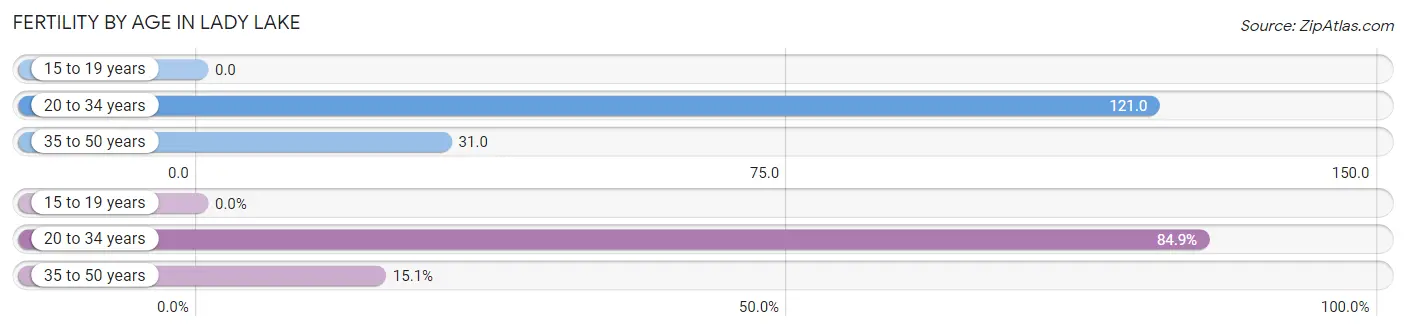
Fertility by Age in Lady Lake
Average fertility rate in Lady Lake is 74.0 births per 1,000 women. Women in the age bracket of 20 to 34 years have the highest fertility rate with 121.0 births per 1,000 women. Women in the age bracket of 20 to 34 years acount for 84.9% of all women with births.
| Age Bracket | Women with Births | Births / 1,000 Women |
| 15 to 19 years | 0 (0.0%) | 0.0 |
| 20 to 34 years | 135 (84.9%) | 121.0 |
| 35 to 50 years | 24 (15.1%) | 31.0 |
| Total | 159 (100.0%) | 74.0 |
Fertility by Age by Marriage Status in Lady Lake
13.2% of women with births (159) in Lady Lake are married. The highest percentage of unmarried women with births falls into 35 to 50 years age bracket with 100.0% of them unmarried at the time of birth, while the lowest percentage of unmarried women with births belong to 20 to 34 years age bracket with 84.4% of them unmarried.
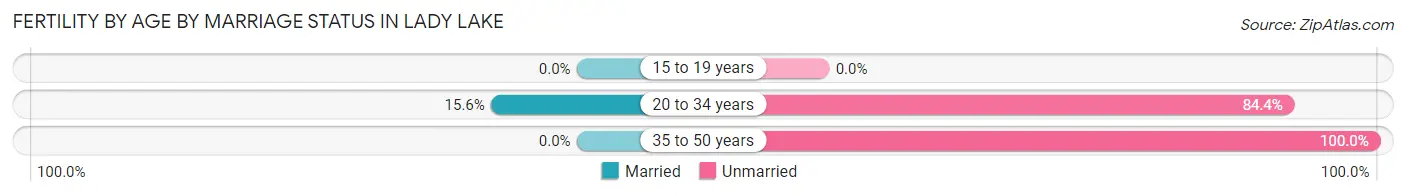
| Age Bracket | Married | Unmarried |
| 15 to 19 years | 0 (0.0%) | 0 (0.0%) |
| 20 to 34 years | 21 (15.6%) | 114 (84.4%) |
| 35 to 50 years | 0 (0.0%) | 24 (100.0%) |
| Total | 21 (13.2%) | 138 (86.8%) |
Fertility by Education in Lady Lake
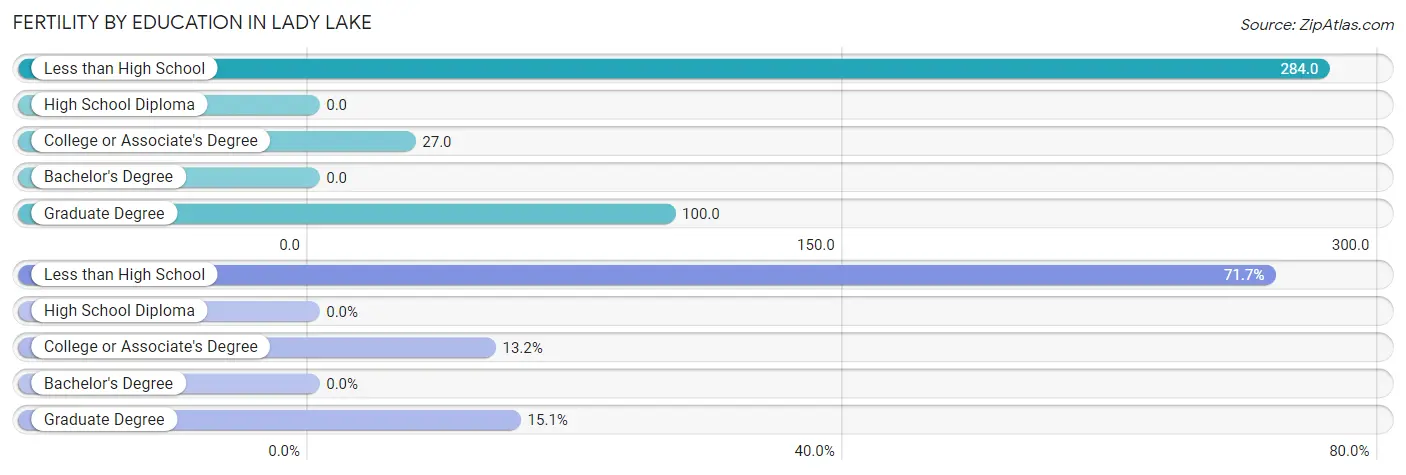
| Educational Attainment | Women with Births | Births / 1,000 Women |
| Less than High School | 114 (71.7%) | 284.0 |
| High School Diploma | 0 (0.0%) | 0.0 |
| College or Associate's Degree | 21 (13.2%) | 27.0 |
| Bachelor's Degree | 0 (0.0%) | 0.0 |
| Graduate Degree | 24 (15.1%) | 100.0 |
| Total | 159 (100.0%) | 74.0 |
Fertility by Education by Marriage Status in Lady Lake
86.8% of women with births in Lady Lake are unmarried. Women with the educational attainment of college or associate's degree are most likely to be married with 100.0% of them married at childbirth, while women with the educational attainment of less than high school are least likely to be married with 100.0% of them unmarried at childbirth.
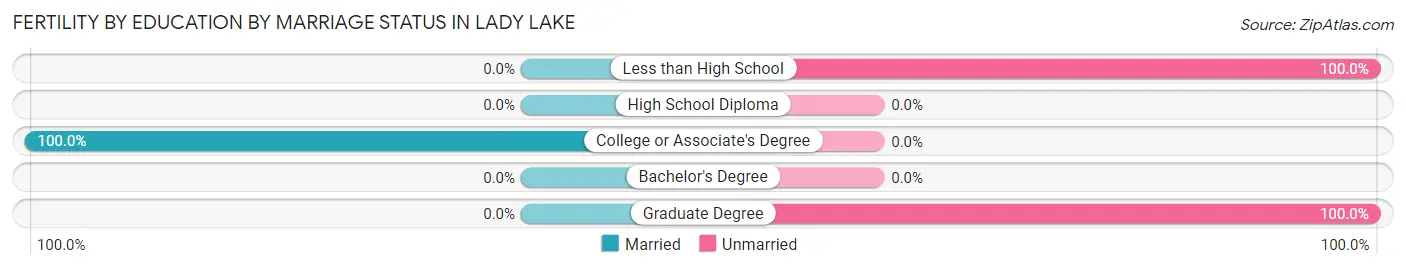
| Educational Attainment | Married | Unmarried |
| Less than High School | 0 (0.0%) | 114 (100.0%) |
| High School Diploma | 0 (0.0%) | 0 (0.0%) |
| College or Associate's Degree | 21 (100.0%) | 0 (0.0%) |
| Bachelor's Degree | 0 (0.0%) | 0 (0.0%) |
| Graduate Degree | 0 (0.0%) | 24 (100.0%) |
| Total | 21 (13.2%) | 138 (86.8%) |
Employment Characteristics in Lady Lake
Employment by Class of Employer in Lady Lake
Among the 4,636 employed individuals in Lady Lake, private company employees (3,603 | 77.7%), not-for-profit organizations (342 | 7.4%), and self-employed (incorporated) (217 | 4.7%) make up the most common classes of employment.
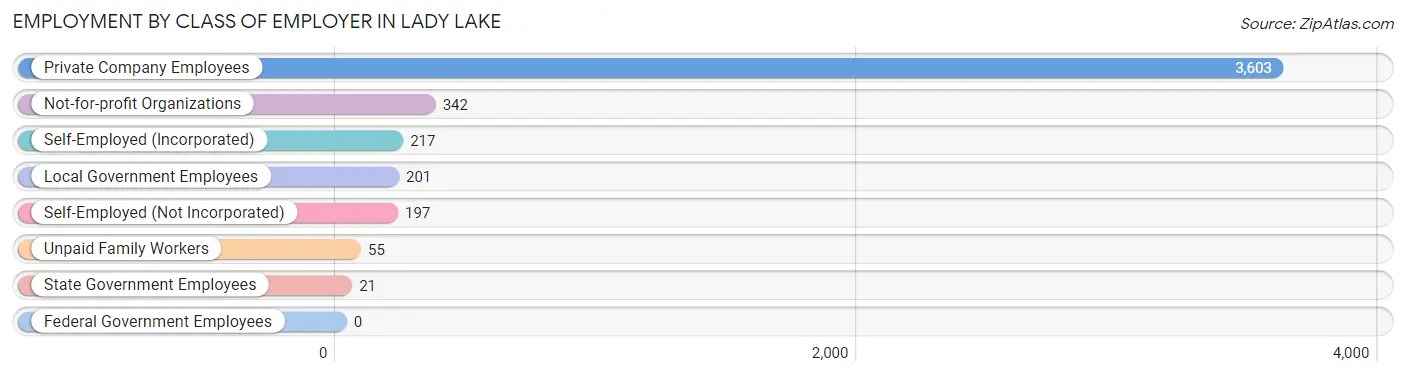
| Employer Class | # Employees | % Employees |
| Private Company Employees | 3,603 | 77.7% |
| Self-Employed (Incorporated) | 217 | 4.7% |
| Self-Employed (Not Incorporated) | 197 | 4.3% |
| Not-for-profit Organizations | 342 | 7.4% |
| Local Government Employees | 201 | 4.3% |
| State Government Employees | 21 | 0.4% |
| Federal Government Employees | 0 | 0.0% |
| Unpaid Family Workers | 55 | 1.2% |
| Total | 4,636 | 100.0% |
Employment Status by Age in Lady Lake
According to the labor force statistics for Lady Lake, out of the total population over 16 years of age (14,528), 35.1% or 5,099 individuals are in the labor force, with 7.7% or 393 of them unemployed. The age group with the highest labor force participation rate is 20 to 24 years, with 100.0% or 568 individuals in the labor force. Within the labor force, the 45 to 54 years age range has the highest percentage of unemployed individuals, with 24.1% or 151 of them being unemployed.
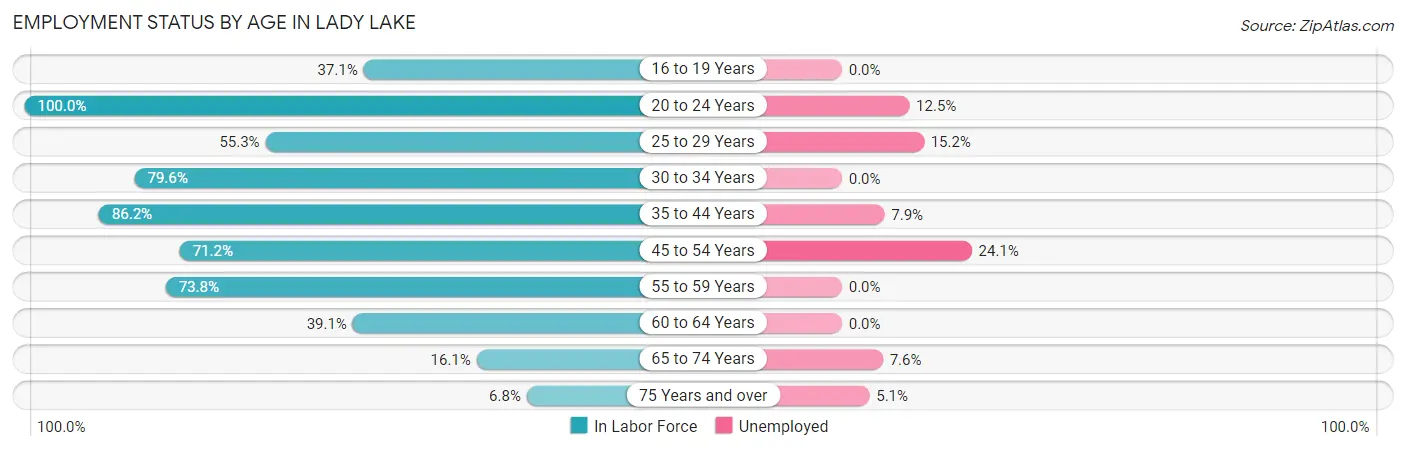
| Age Bracket | In Labor Force | Unemployed |
| 16 to 19 Years | 117 (37.1%) | 0 (0.0%) |
| 20 to 24 Years | 568 (100.0%) | 71 (12.5%) |
| 25 to 29 Years | 323 (55.3%) | 49 (15.2%) |
| 30 to 34 Years | 477 (79.6%) | 0 (0.0%) |
| 35 to 44 Years | 784 (86.2%) | 62 (7.9%) |
| 45 to 54 Years | 626 (71.2%) | 151 (24.1%) |
| 55 to 59 Years | 731 (73.8%) | 0 (0.0%) |
| 60 to 64 Years | 595 (39.1%) | 0 (0.0%) |
| 65 to 74 Years | 568 (16.1%) | 43 (7.6%) |
| 75 Years and over | 315 (6.8%) | 16 (5.1%) |
| Total | 5,099 (35.1%) | 393 (7.7%) |
Employment Status by Educational Attainment in Lady Lake
According to labor force statistics for Lady Lake, 64.5% of individuals (3,537) out of the total population between 25 and 64 years of age (5,483) are in the labor force, with 7.4% or 262 of them being unemployed. The group with the highest labor force participation rate are those with the educational attainment of bachelor's degree or higher, with 71.2% or 913 individuals in the labor force. Within the labor force, individuals with high school diploma education have the highest percentage of unemployment, with 11.8% or 110 of them being unemployed.
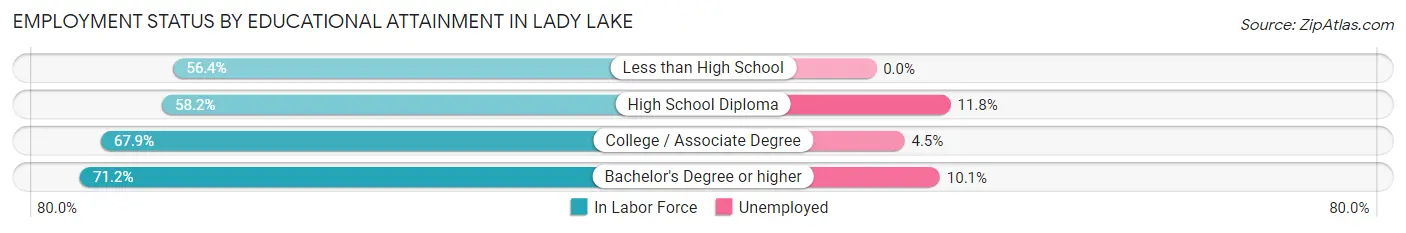
| Educational Attainment | In Labor Force | Unemployed |
| Less than High School | 369 (56.4%) | 0 (0.0%) |
| High School Diploma | 931 (58.2%) | 189 (11.8%) |
| College / Associate Degree | 1,322 (67.9%) | 88 (4.5%) |
| Bachelor's Degree or higher | 913 (71.2%) | 130 (10.1%) |
| Total | 3,537 (64.5%) | 406 (7.4%) |
Employment Occupations by Sex in Lady Lake
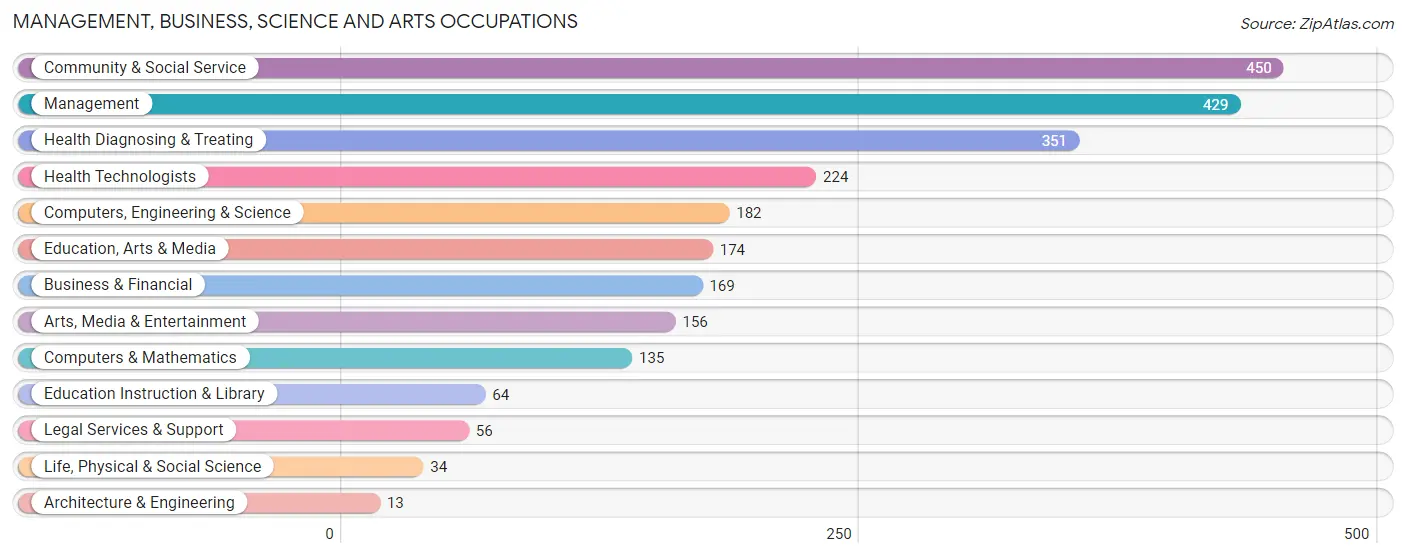
Management, Business, Science and Arts Occupations
The most common Management, Business, Science and Arts occupations in Lady Lake are Community & Social Service (450 | 9.6%), Management (429 | 9.1%), Health Diagnosing & Treating (351 | 7.4%), Health Technologists (224 | 4.8%), and Computers, Engineering & Science (182 | 3.9%).
Management, Business, Science and Arts Occupations by Sex
Within the Management, Business, Science and Arts occupations in Lady Lake, the most male-oriented occupations are Architecture & Engineering (100.0%), Business & Financial (68.0%), and Management (60.8%), while the most female-oriented occupations are Life, Physical & Social Science (100.0%), Education, Arts & Media (83.3%), and Legal Services & Support (78.6%).
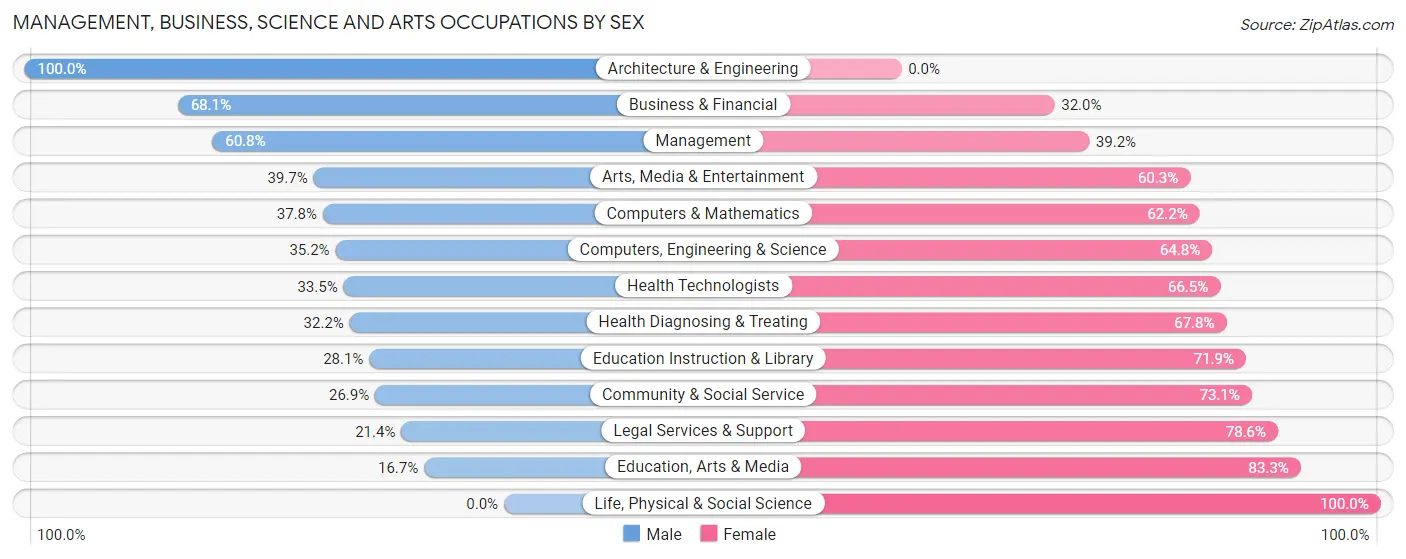
| Occupation | Male | Female |
| Management | 261 (60.8%) | 168 (39.2%) |
| Business & Financial | 115 (68.0%) | 54 (32.0%) |
| Computers, Engineering & Science | 64 (35.2%) | 118 (64.8%) |
| Computers & Mathematics | 51 (37.8%) | 84 (62.2%) |
| Architecture & Engineering | 13 (100.0%) | 0 (0.0%) |
| Life, Physical & Social Science | 0 (0.0%) | 34 (100.0%) |
| Community & Social Service | 121 (26.9%) | 329 (73.1%) |
| Education, Arts & Media | 29 (16.7%) | 145 (83.3%) |
| Legal Services & Support | 12 (21.4%) | 44 (78.6%) |
| Education Instruction & Library | 18 (28.1%) | 46 (71.9%) |
| Arts, Media & Entertainment | 62 (39.7%) | 94 (60.3%) |
| Health Diagnosing & Treating | 113 (32.2%) | 238 (67.8%) |
| Health Technologists | 75 (33.5%) | 149 (66.5%) |
| Total (Category) | 674 (42.6%) | 907 (57.4%) |
| Total (Overall) | 2,135 (45.3%) | 2,575 (54.7%) |
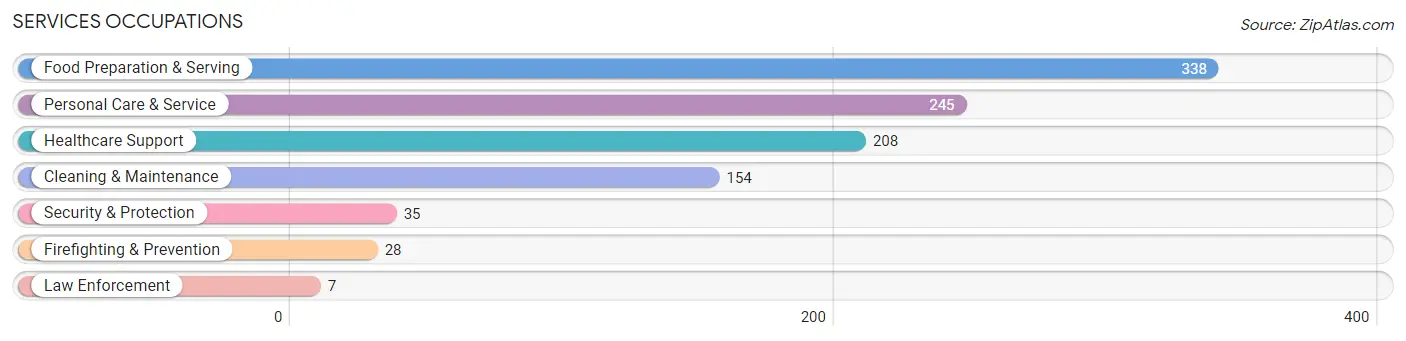
Services Occupations
The most common Services occupations in Lady Lake are Food Preparation & Serving (338 | 7.2%), Personal Care & Service (245 | 5.2%), Healthcare Support (208 | 4.4%), Cleaning & Maintenance (154 | 3.3%), and Security & Protection (35 | 0.7%).
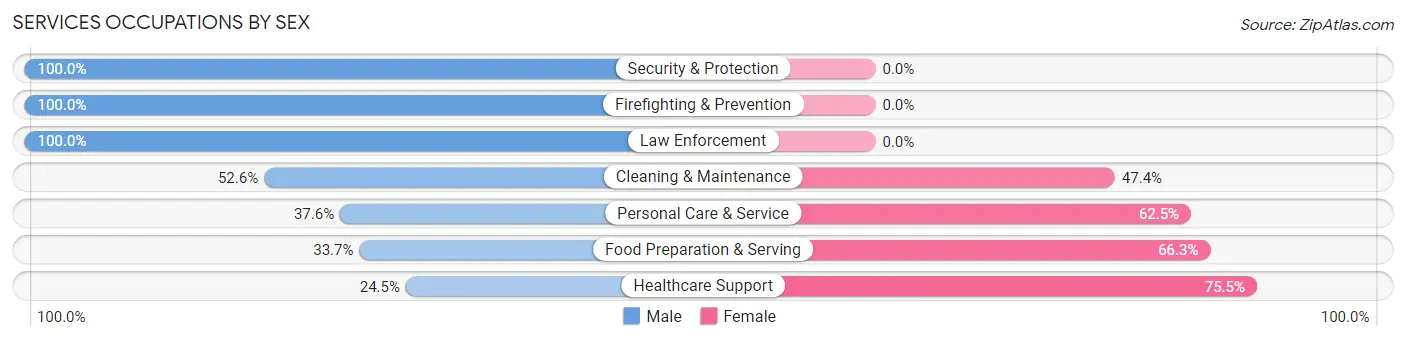
Services Occupations by Sex
Within the Services occupations in Lady Lake, the most male-oriented occupations are Security & Protection (100.0%), Firefighting & Prevention (100.0%), and Law Enforcement (100.0%), while the most female-oriented occupations are Healthcare Support (75.5%), Food Preparation & Serving (66.3%), and Personal Care & Service (62.5%).
| Occupation | Male | Female |
| Healthcare Support | 51 (24.5%) | 157 (75.5%) |
| Security & Protection | 35 (100.0%) | 0 (0.0%) |
| Firefighting & Prevention | 28 (100.0%) | 0 (0.0%) |
| Law Enforcement | 7 (100.0%) | 0 (0.0%) |
| Food Preparation & Serving | 114 (33.7%) | 224 (66.3%) |
| Cleaning & Maintenance | 81 (52.6%) | 73 (47.4%) |
| Personal Care & Service | 92 (37.6%) | 153 (62.5%) |
| Total (Category) | 373 (38.1%) | 607 (61.9%) |
| Total (Overall) | 2,135 (45.3%) | 2,575 (54.7%) |
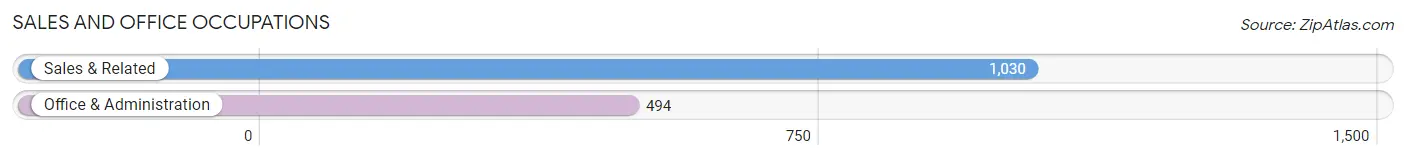
Sales and Office Occupations
The most common Sales and Office occupations in Lady Lake are Sales & Related (1,030 | 21.9%), and Office & Administration (494 | 10.5%).
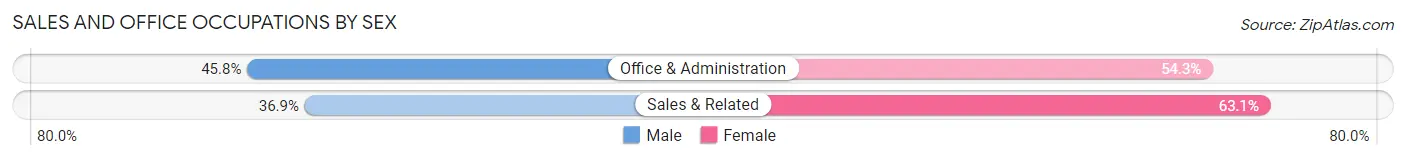
Sales and Office Occupations by Sex
| Occupation | Male | Female |
| Sales & Related | 380 (36.9%) | 650 (63.1%) |
| Office & Administration | 226 (45.8%) | 268 (54.2%) |
| Total (Category) | 606 (39.8%) | 918 (60.2%) |
| Total (Overall) | 2,135 (45.3%) | 2,575 (54.7%) |
Natural Resources, Construction and Maintenance Occupations
The most common Natural Resources, Construction and Maintenance occupations in Lady Lake are Construction & Extraction (85 | 1.8%), Installation, Maintenance & Repair (48 | 1.0%), and Farming, Fishing & Forestry (16 | 0.3%).
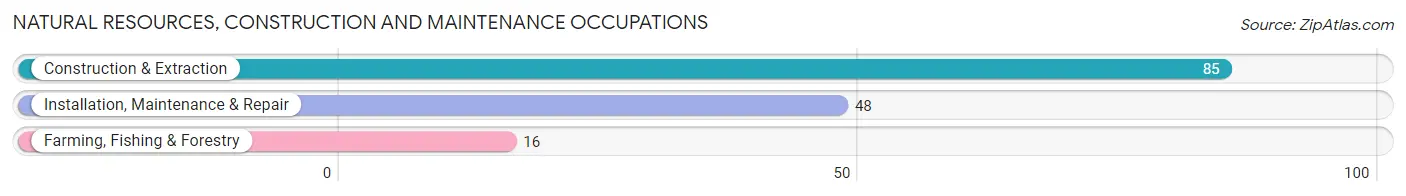
Natural Resources, Construction and Maintenance Occupations by Sex
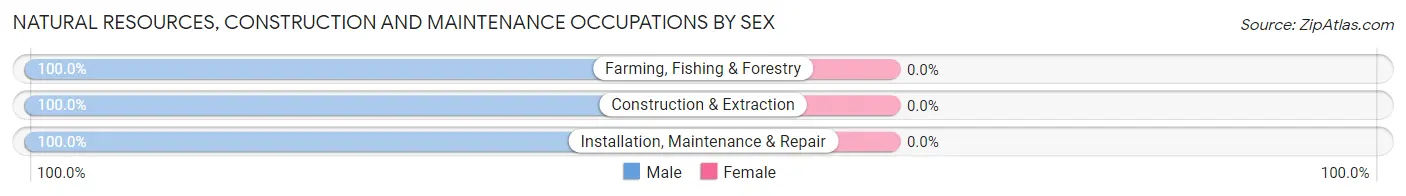
| Occupation | Male | Female |
| Farming, Fishing & Forestry | 16 (100.0%) | 0 (0.0%) |
| Construction & Extraction | 85 (100.0%) | 0 (0.0%) |
| Installation, Maintenance & Repair | 48 (100.0%) | 0 (0.0%) |
| Total (Category) | 149 (100.0%) | 0 (0.0%) |
| Total (Overall) | 2,135 (45.3%) | 2,575 (54.7%) |
Production, Transportation and Moving Occupations
The most common Production, Transportation and Moving occupations in Lady Lake are Production (233 | 5.0%), Transportation (164 | 3.5%), and Material Moving (79 | 1.7%).
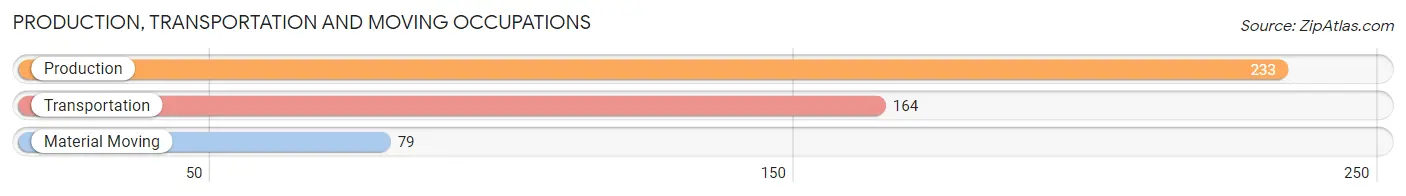
Production, Transportation and Moving Occupations by Sex
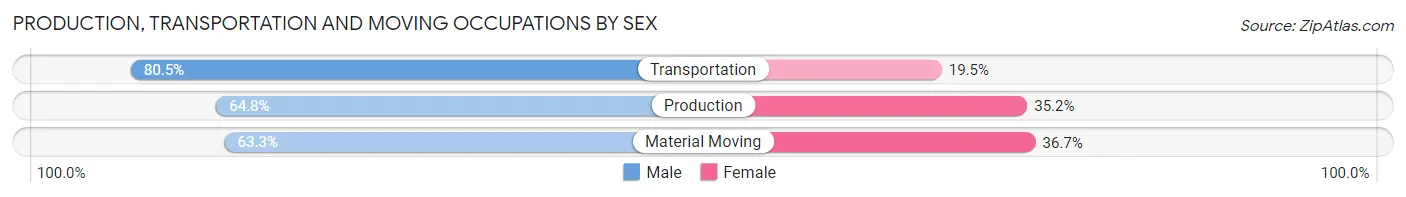
| Occupation | Male | Female |
| Production | 151 (64.8%) | 82 (35.2%) |
| Transportation | 132 (80.5%) | 32 (19.5%) |
| Material Moving | 50 (63.3%) | 29 (36.7%) |
| Total (Category) | 333 (70.0%) | 143 (30.0%) |
| Total (Overall) | 2,135 (45.3%) | 2,575 (54.7%) |
Employment Industries by Sex in Lady Lake
Employment Industries in Lady Lake
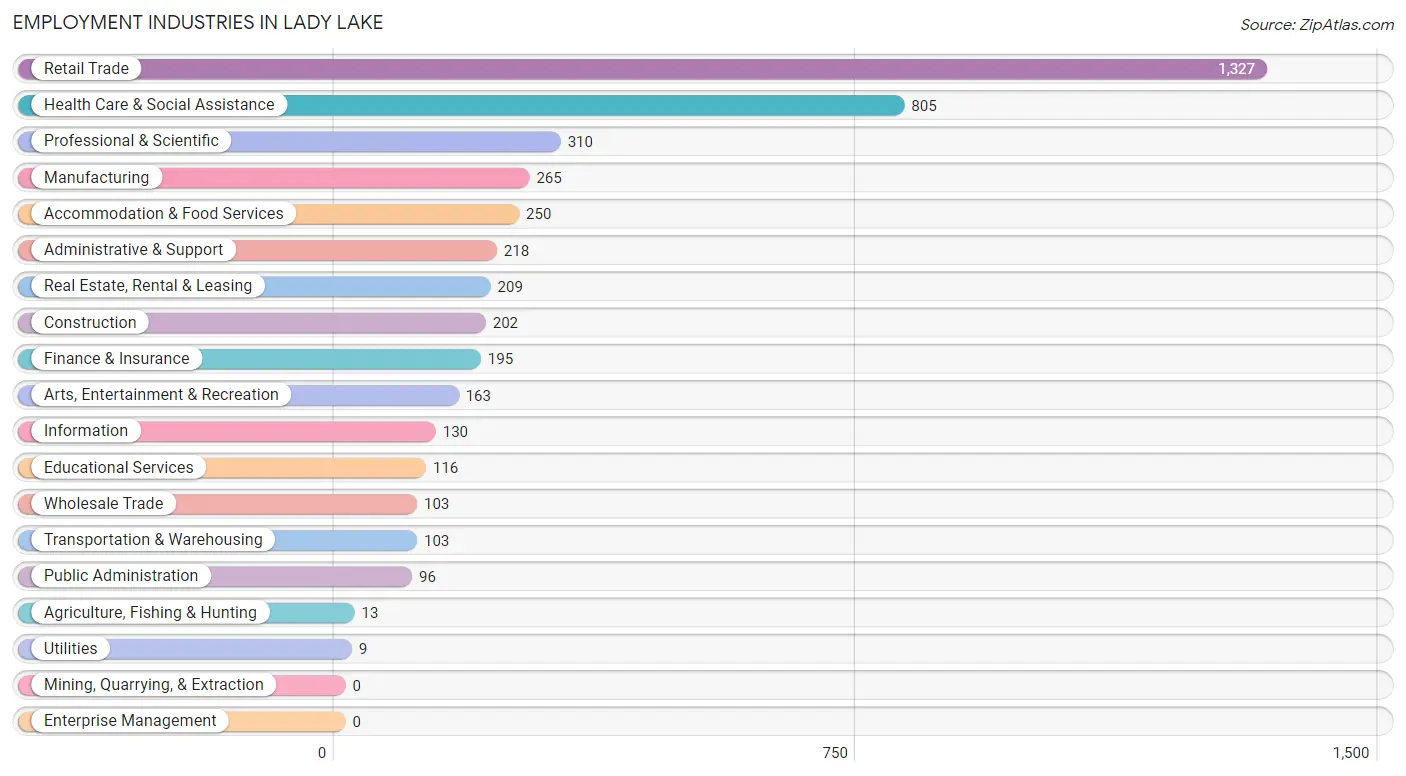
The major employment industries in Lady Lake include Retail Trade (1,327 | 28.2%), Health Care & Social Assistance (805 | 17.1%), Professional & Scientific (310 | 6.6%), Manufacturing (265 | 5.6%), and Accommodation & Food Services (250 | 5.3%).
Employment Industries by Sex in Lady Lake
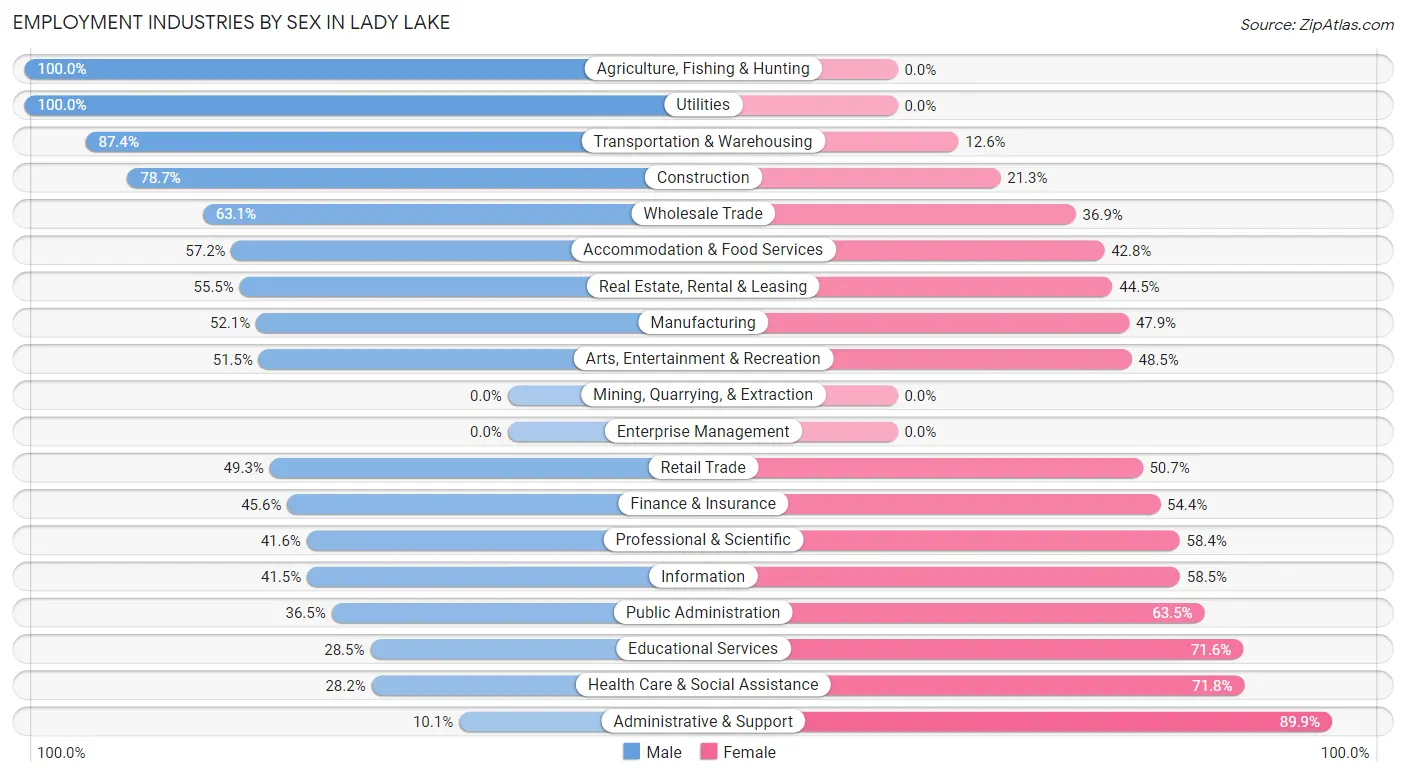
The Lady Lake industries that see more men than women are Agriculture, Fishing & Hunting (100.0%), Utilities (100.0%), and Transportation & Warehousing (87.4%), whereas the industries that tend to have a higher number of women are Administrative & Support (89.9%), Health Care & Social Assistance (71.8%), and Educational Services (71.6%).
| Industry | Male | Female |
| Agriculture, Fishing & Hunting | 13 (100.0%) | 0 (0.0%) |
| Mining, Quarrying, & Extraction | 0 (0.0%) | 0 (0.0%) |
| Construction | 159 (78.7%) | 43 (21.3%) |
| Manufacturing | 138 (52.1%) | 127 (47.9%) |
| Wholesale Trade | 65 (63.1%) | 38 (36.9%) |
| Retail Trade | 654 (49.3%) | 673 (50.7%) |
| Transportation & Warehousing | 90 (87.4%) | 13 (12.6%) |
| Utilities | 9 (100.0%) | 0 (0.0%) |
| Information | 54 (41.5%) | 76 (58.5%) |
| Finance & Insurance | 89 (45.6%) | 106 (54.4%) |
| Real Estate, Rental & Leasing | 116 (55.5%) | 93 (44.5%) |
| Professional & Scientific | 129 (41.6%) | 181 (58.4%) |
| Enterprise Management | 0 (0.0%) | 0 (0.0%) |
| Administrative & Support | 22 (10.1%) | 196 (89.9%) |
| Educational Services | 33 (28.4%) | 83 (71.6%) |
| Health Care & Social Assistance | 227 (28.2%) | 578 (71.8%) |
| Arts, Entertainment & Recreation | 84 (51.5%) | 79 (48.5%) |
| Accommodation & Food Services | 143 (57.2%) | 107 (42.8%) |
| Public Administration | 35 (36.5%) | 61 (63.5%) |
| Total | 2,135 (45.3%) | 2,575 (54.7%) |
Education in Lady Lake
School Enrollment in Lady Lake
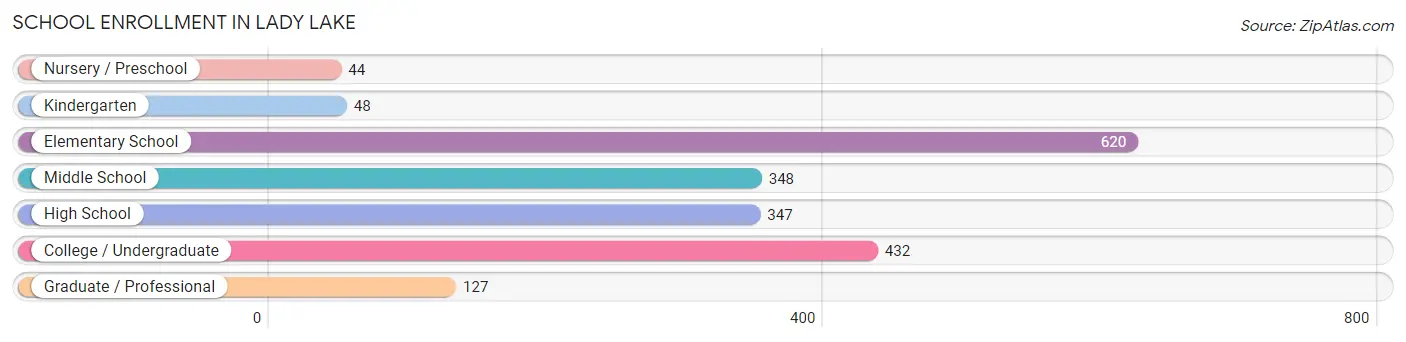
The most common levels of schooling among the 1,966 students in Lady Lake are elementary school (620 | 31.5%), college / undergraduate (432 | 22.0%), and middle school (348 | 17.7%).
| School Level | # Students | % Students |
| Nursery / Preschool | 44 | 2.2% |
| Kindergarten | 48 | 2.4% |
| Elementary School | 620 | 31.5% |
| Middle School | 348 | 17.7% |
| High School | 347 | 17.6% |
| College / Undergraduate | 432 | 22.0% |
| Graduate / Professional | 127 | 6.5% |
| Total | 1,966 | 100.0% |
School Enrollment by Age by Funding Source in Lady Lake
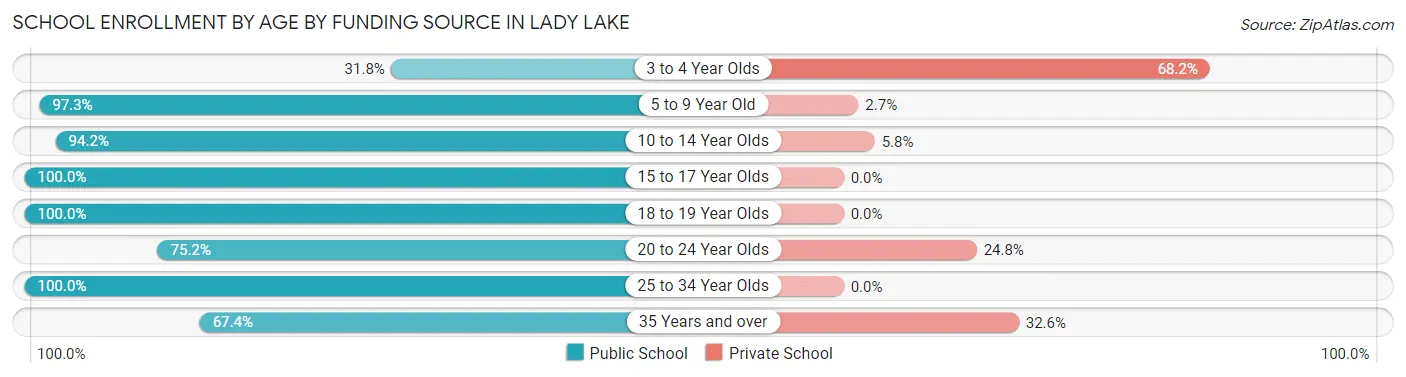
Out of a total of 1,966 students who are enrolled in schools in Lady Lake, 216 (11.0%) attend a private institution, while the remaining 1,750 (89.0%) are enrolled in public schools. The age group of 3 to 4 year olds has the highest likelihood of being enrolled in private schools, with 30 (68.2% in the age bracket) enrolled. Conversely, the age group of 15 to 17 year olds has the lowest likelihood of being enrolled in a private school, with 294 (100.0% in the age bracket) attending a public institution.
| Age Bracket | Public School | Private School |
| 3 to 4 Year Olds | 14 (31.8%) | 30 (68.2%) |
| 5 to 9 Year Old | 640 (97.3%) | 18 (2.7%) |
| 10 to 14 Year Olds | 342 (94.2%) | 21 (5.8%) |
| 15 to 17 Year Olds | 294 (100.0%) | 0 (0.0%) |
| 18 to 19 Year Olds | 87 (100.0%) | 0 (0.0%) |
| 20 to 24 Year Olds | 170 (75.2%) | 56 (24.8%) |
| 25 to 34 Year Olds | 12 (100.0%) | 0 (0.0%) |
| 35 Years and over | 190 (67.4%) | 92 (32.6%) |
| Total | 1,750 (89.0%) | 216 (11.0%) |
Educational Attainment by Field of Study in Lady Lake
Education (768 | 22.3%), business (642 | 18.6%), science & technology (380 | 11.0%), arts & humanities (216 | 6.3%), and engineering (213 | 6.2%) are the most common fields of study among 3,449 individuals in Lady Lake who have obtained a bachelor's degree or higher.
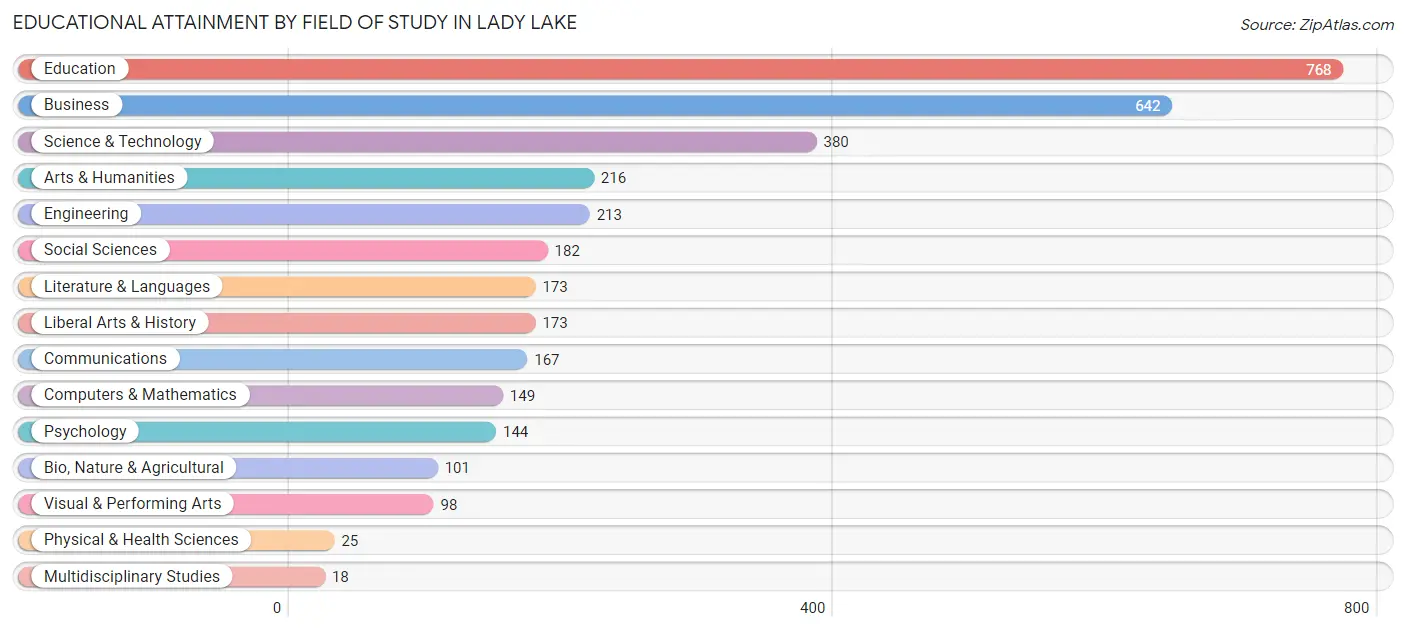
| Field of Study | # Graduates | % Graduates |
| Computers & Mathematics | 149 | 4.3% |
| Bio, Nature & Agricultural | 101 | 2.9% |
| Physical & Health Sciences | 25 | 0.7% |
| Psychology | 144 | 4.2% |
| Social Sciences | 182 | 5.3% |
| Engineering | 213 | 6.2% |
| Multidisciplinary Studies | 18 | 0.5% |
| Science & Technology | 380 | 11.0% |
| Business | 642 | 18.6% |
| Education | 768 | 22.3% |
| Literature & Languages | 173 | 5.0% |
| Liberal Arts & History | 173 | 5.0% |
| Visual & Performing Arts | 98 | 2.8% |
| Communications | 167 | 4.8% |
| Arts & Humanities | 216 | 6.3% |
| Total | 3,449 | 100.0% |
Transportation & Commute in Lady Lake
Vehicle Availability by Sex in Lady Lake
The most prevalent vehicle ownership categories in Lady Lake are males with 2 vehicles (1,014, accounting for 47.5%) and females with 2 vehicles (1,148, making up 40.7%).
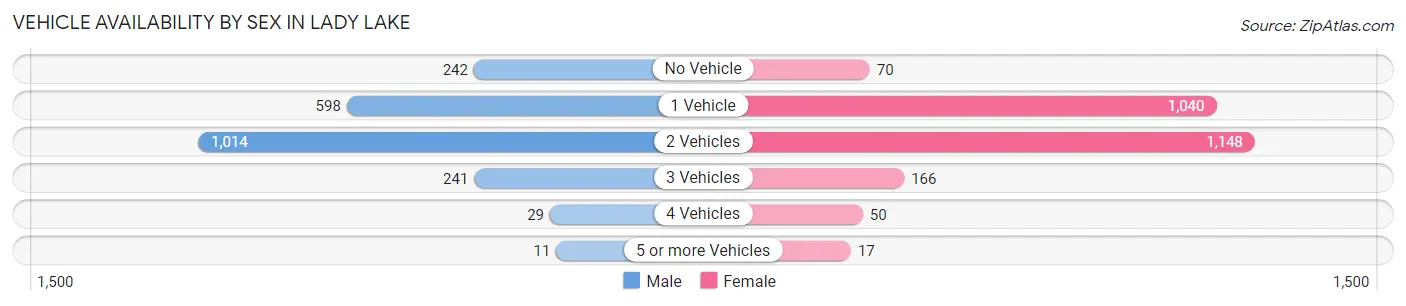
| Vehicles Available | Male | Female |
| No Vehicle | 242 (11.3%) | 70 (2.8%) |
| 1 Vehicle | 598 (28.0%) | 1,040 (41.7%) |
| 2 Vehicles | 1,014 (47.5%) | 1,148 (46.1%) |
| 3 Vehicles | 241 (11.3%) | 166 (6.7%) |
| 4 Vehicles | 29 (1.4%) | 50 (2.0%) |
| 5 or more Vehicles | 11 (0.5%) | 17 (0.7%) |
| Total | 2,135 (100.0%) | 2,491 (100.0%) |
Commute Time in Lady Lake
The most frequently occuring commute durations in Lady Lake are 5 to 9 minutes (905 commuters, 20.4%), 10 to 14 minutes (874 commuters, 19.8%), and 15 to 19 minutes (534 commuters, 12.1%).
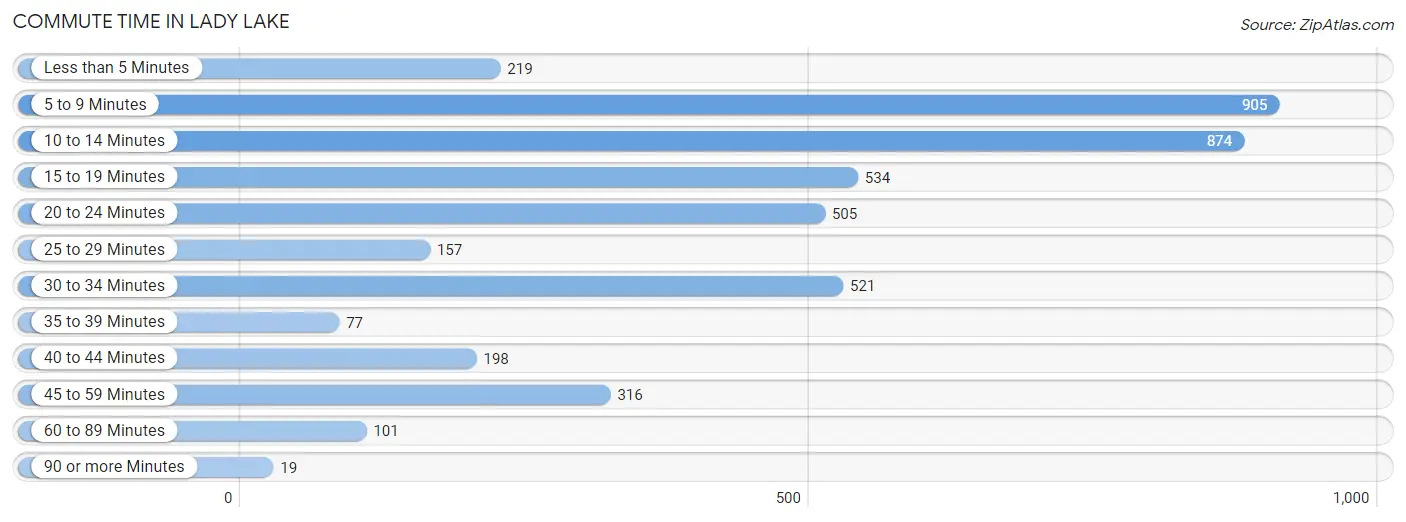
| Commute Time | # Commuters | % Commuters |
| Less than 5 Minutes | 219 | 5.0% |
| 5 to 9 Minutes | 905 | 20.4% |
| 10 to 14 Minutes | 874 | 19.8% |
| 15 to 19 Minutes | 534 | 12.1% |
| 20 to 24 Minutes | 505 | 11.4% |
| 25 to 29 Minutes | 157 | 3.5% |
| 30 to 34 Minutes | 521 | 11.8% |
| 35 to 39 Minutes | 77 | 1.7% |
| 40 to 44 Minutes | 198 | 4.5% |
| 45 to 59 Minutes | 316 | 7.1% |
| 60 to 89 Minutes | 101 | 2.3% |
| 90 or more Minutes | 19 | 0.4% |
Commute Time by Sex in Lady Lake
The most common commute times in Lady Lake are 10 to 14 minutes (434 commuters, 21.2%) for males and 5 to 9 minutes (500 commuters, 21.0%) for females.
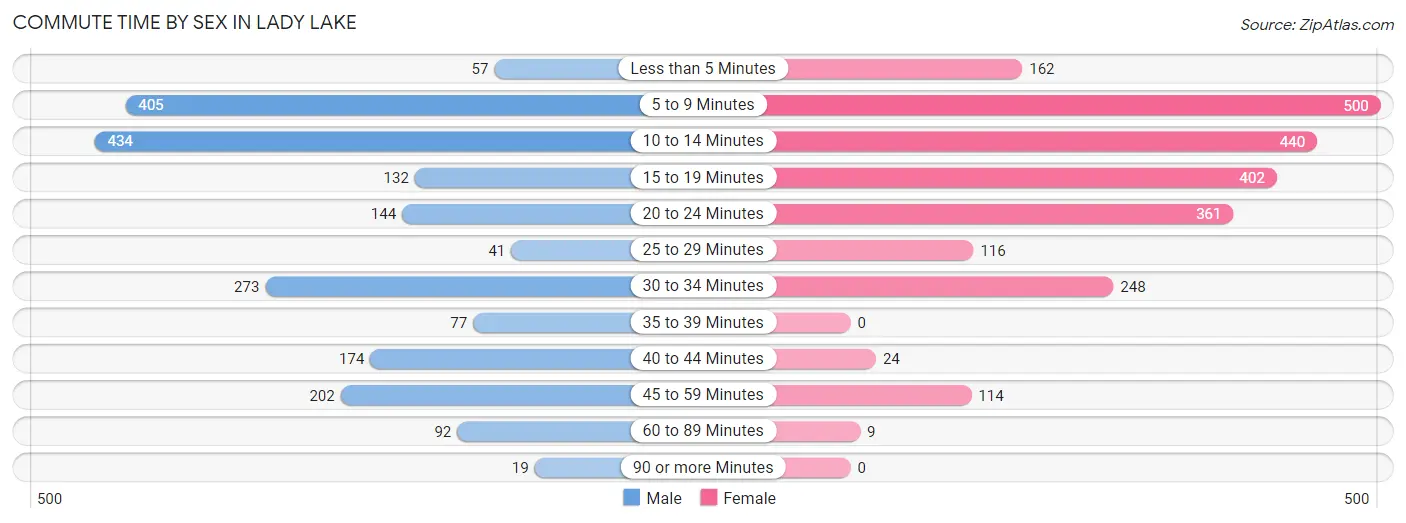
| Commute Time | Male | Female |
| Less than 5 Minutes | 57 (2.8%) | 162 (6.8%) |
| 5 to 9 Minutes | 405 (19.8%) | 500 (21.0%) |
| 10 to 14 Minutes | 434 (21.2%) | 440 (18.5%) |
| 15 to 19 Minutes | 132 (6.4%) | 402 (16.9%) |
| 20 to 24 Minutes | 144 (7.0%) | 361 (15.2%) |
| 25 to 29 Minutes | 41 (2.0%) | 116 (4.9%) |
| 30 to 34 Minutes | 273 (13.3%) | 248 (10.4%) |
| 35 to 39 Minutes | 77 (3.8%) | 0 (0.0%) |
| 40 to 44 Minutes | 174 (8.5%) | 24 (1.0%) |
| 45 to 59 Minutes | 202 (9.9%) | 114 (4.8%) |
| 60 to 89 Minutes | 92 (4.5%) | 9 (0.4%) |
| 90 or more Minutes | 19 (0.9%) | 0 (0.0%) |
Time of Departure to Work by Sex in Lady Lake
The most frequent times of departure to work in Lady Lake are 9:00 AM to 9:59 AM (279, 13.6%) for males and 7:00 AM to 7:29 AM (438, 18.4%) for females.
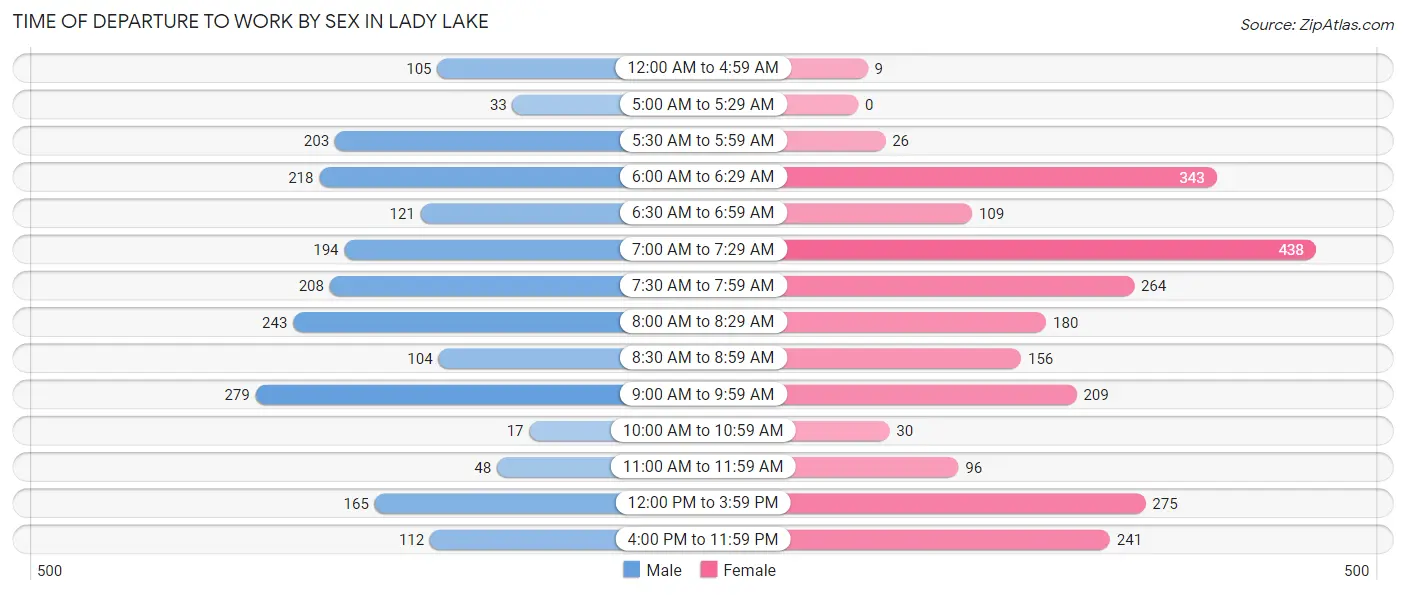
| Time of Departure | Male | Female |
| 12:00 AM to 4:59 AM | 105 (5.1%) | 9 (0.4%) |
| 5:00 AM to 5:29 AM | 33 (1.6%) | 0 (0.0%) |
| 5:30 AM to 5:59 AM | 203 (9.9%) | 26 (1.1%) |
| 6:00 AM to 6:29 AM | 218 (10.6%) | 343 (14.4%) |
| 6:30 AM to 6:59 AM | 121 (5.9%) | 109 (4.6%) |
| 7:00 AM to 7:29 AM | 194 (9.5%) | 438 (18.4%) |
| 7:30 AM to 7:59 AM | 208 (10.2%) | 264 (11.1%) |
| 8:00 AM to 8:29 AM | 243 (11.8%) | 180 (7.6%) |
| 8:30 AM to 8:59 AM | 104 (5.1%) | 156 (6.6%) |
| 9:00 AM to 9:59 AM | 279 (13.6%) | 209 (8.8%) |
| 10:00 AM to 10:59 AM | 17 (0.8%) | 30 (1.3%) |
| 11:00 AM to 11:59 AM | 48 (2.3%) | 96 (4.0%) |
| 12:00 PM to 3:59 PM | 165 (8.1%) | 275 (11.6%) |
| 4:00 PM to 11:59 PM | 112 (5.5%) | 241 (10.1%) |
| Total | 2,050 (100.0%) | 2,376 (100.0%) |
Housing Occupancy in Lady Lake
Occupancy by Ownership in Lady Lake
Of the total 8,250 dwellings in Lady Lake, owner-occupied units account for 6,002 (72.8%), while renter-occupied units make up 2,248 (27.3%).
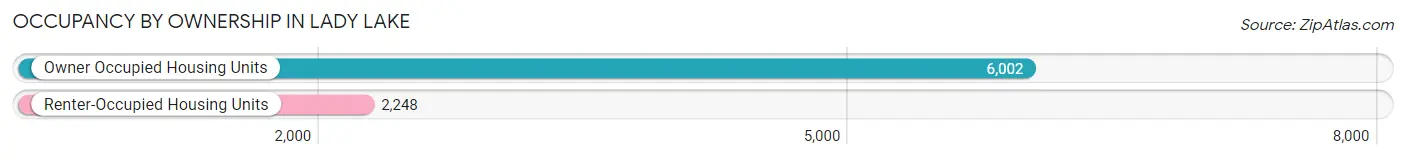
| Occupancy | # Housing Units | % Housing Units |
| Owner Occupied Housing Units | 6,002 | 72.8% |
| Renter-Occupied Housing Units | 2,248 | 27.3% |
| Total Occupied Housing Units | 8,250 | 100.0% |
Occupancy by Household Size in Lady Lake
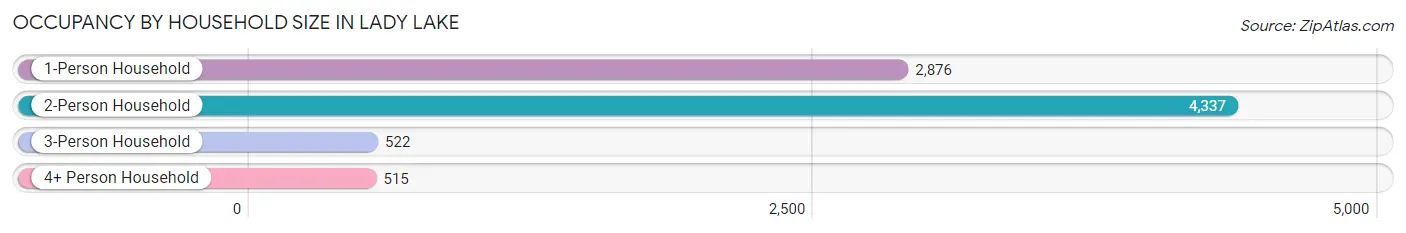
| Household Size | # Housing Units | % Housing Units |
| 1-Person Household | 2,876 | 34.9% |
| 2-Person Household | 4,337 | 52.6% |
| 3-Person Household | 522 | 6.3% |
| 4+ Person Household | 515 | 6.2% |
| Total Housing Units | 8,250 | 100.0% |
Occupancy by Ownership by Household Size in Lady Lake
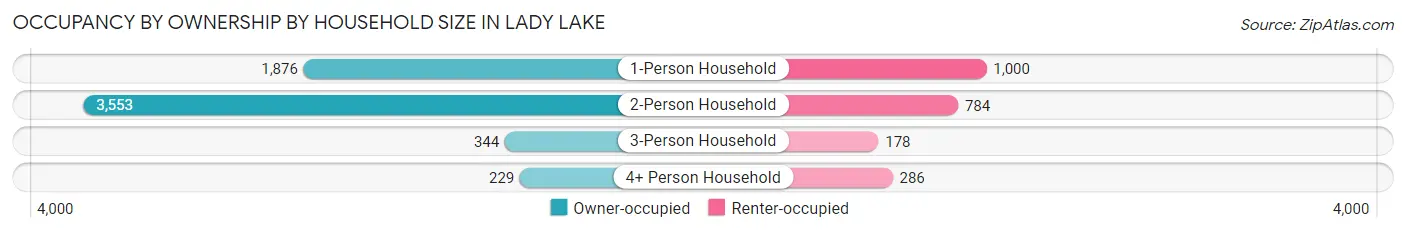
| Household Size | Owner-occupied | Renter-occupied |
| 1-Person Household | 1,876 (65.2%) | 1,000 (34.8%) |
| 2-Person Household | 3,553 (81.9%) | 784 (18.1%) |
| 3-Person Household | 344 (65.9%) | 178 (34.1%) |
| 4+ Person Household | 229 (44.5%) | 286 (55.5%) |
| Total Housing Units | 6,002 (72.8%) | 2,248 (27.3%) |
Occupancy by Educational Attainment in Lady Lake
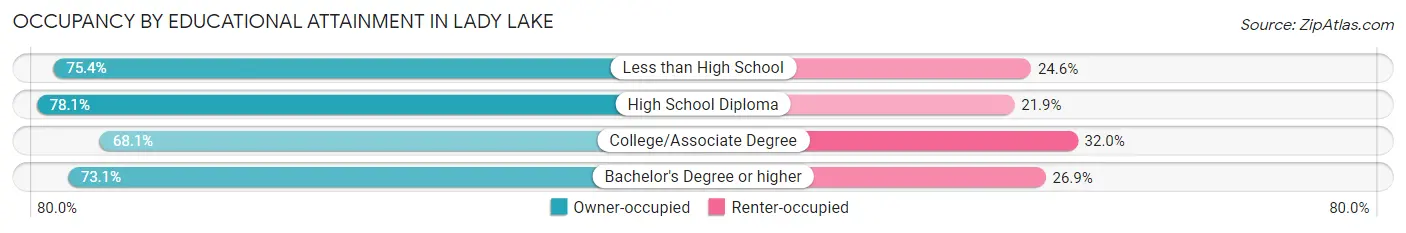
| Household Size | Owner-occupied | Renter-occupied |
| Less than High School | 470 (75.4%) | 153 (24.6%) |
| High School Diploma | 1,871 (78.1%) | 525 (21.9%) |
| College/Associate Degree | 2,204 (68.0%) | 1,035 (32.0%) |
| Bachelor's Degree or higher | 1,457 (73.1%) | 535 (26.9%) |
Occupancy by Age of Householder in Lady Lake
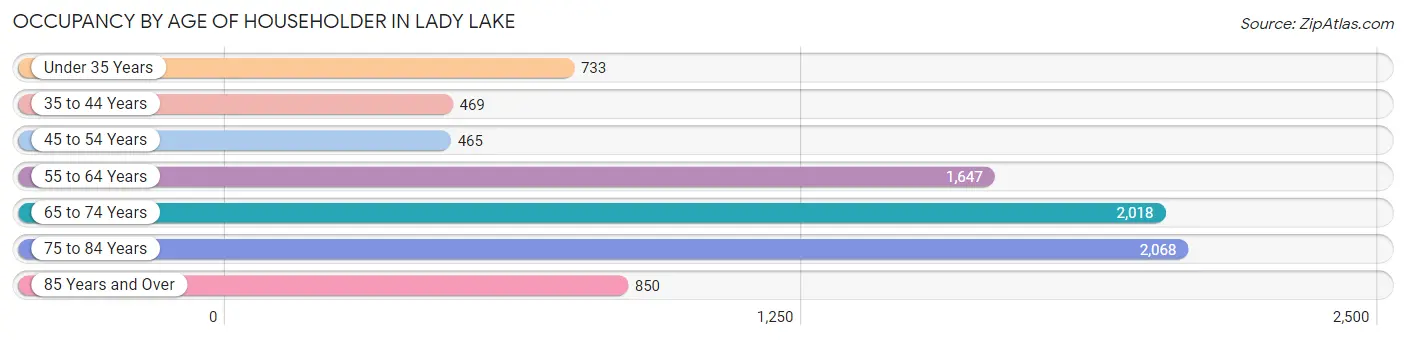
| Age Bracket | # Households | % Households |
| Under 35 Years | 733 | 8.9% |
| 35 to 44 Years | 469 | 5.7% |
| 45 to 54 Years | 465 | 5.6% |
| 55 to 64 Years | 1,647 | 20.0% |
| 65 to 74 Years | 2,018 | 24.5% |
| 75 to 84 Years | 2,068 | 25.1% |
| 85 Years and Over | 850 | 10.3% |
| Total | 8,250 | 100.0% |
Housing Finances in Lady Lake
Median Income by Occupancy in Lady Lake
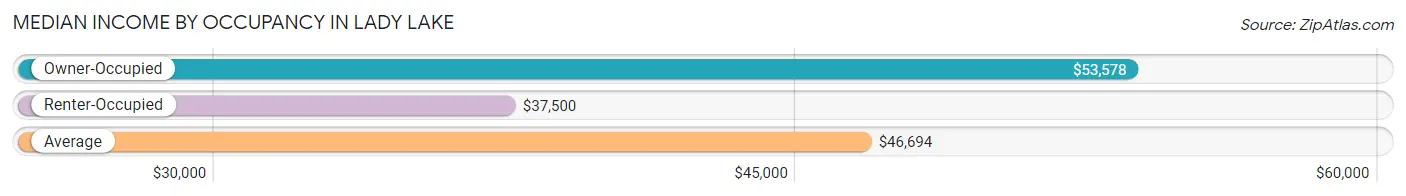
| Occupancy Type | # Households | Median Income |
| Owner-Occupied | 6,002 (72.8%) | $53,578 |
| Renter-Occupied | 2,248 (27.3%) | $37,500 |
| Average | 8,250 (100.0%) | $46,694 |
Occupancy by Householder Income Bracket in Lady Lake
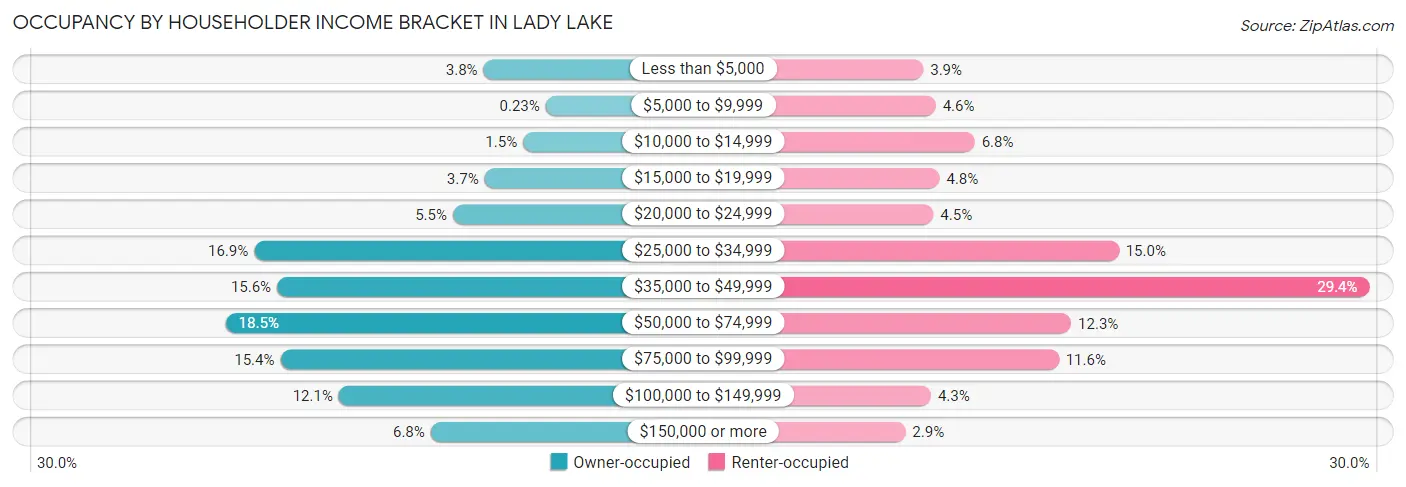
| Income Bracket | Owner-occupied | Renter-occupied |
| Less than $5,000 | 227 (3.8%) | 87 (3.9%) |
| $5,000 to $9,999 | 14 (0.2%) | 103 (4.6%) |
| $10,000 to $14,999 | 91 (1.5%) | 153 (6.8%) |
| $15,000 to $19,999 | 223 (3.7%) | 108 (4.8%) |
| $20,000 to $24,999 | 332 (5.5%) | 100 (4.4%) |
| $25,000 to $34,999 | 1,014 (16.9%) | 338 (15.0%) |
| $35,000 to $49,999 | 935 (15.6%) | 660 (29.4%) |
| $50,000 to $74,999 | 1,111 (18.5%) | 277 (12.3%) |
| $75,000 to $99,999 | 924 (15.4%) | 261 (11.6%) |
| $100,000 to $149,999 | 723 (12.0%) | 97 (4.3%) |
| $150,000 or more | 408 (6.8%) | 64 (2.9%) |
| Total | 6,002 (100.0%) | 2,248 (100.0%) |
Monthly Housing Cost Tiers in Lady Lake
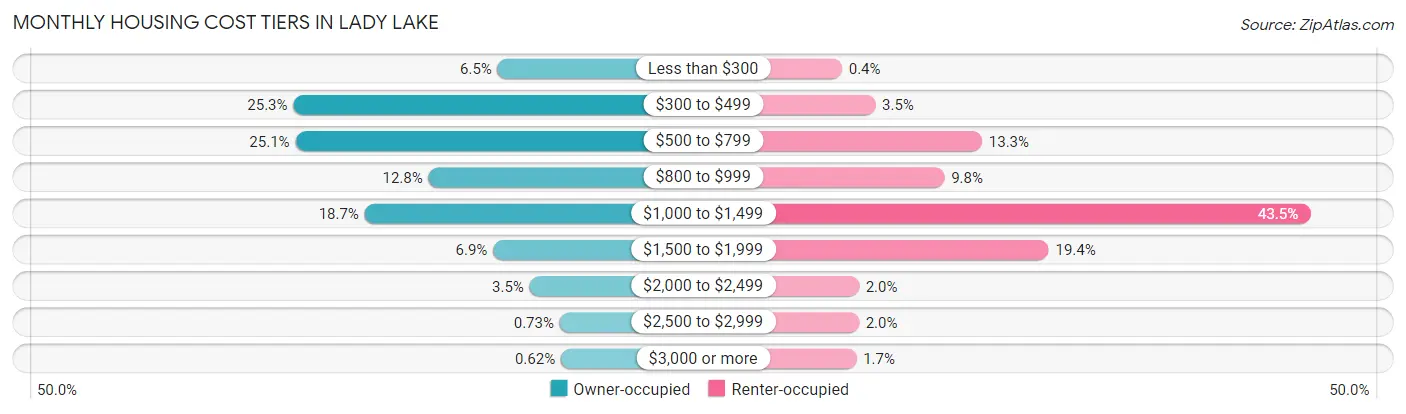
| Monthly Cost | Owner-occupied | Renter-occupied |
| Less than $300 | 387 (6.5%) | 9 (0.4%) |
| $300 to $499 | 1,516 (25.3%) | 78 (3.5%) |
| $500 to $799 | 1,505 (25.1%) | 299 (13.3%) |
| $800 to $999 | 769 (12.8%) | 221 (9.8%) |
| $1,000 to $1,499 | 1,122 (18.7%) | 978 (43.5%) |
| $1,500 to $1,999 | 412 (6.9%) | 437 (19.4%) |
| $2,000 to $2,499 | 210 (3.5%) | 44 (2.0%) |
| $2,500 to $2,999 | 44 (0.7%) | 44 (2.0%) |
| $3,000 or more | 37 (0.6%) | 39 (1.7%) |
| Total | 6,002 (100.0%) | 2,248 (100.0%) |
Physical Housing Characteristics in Lady Lake
Housing Structures in Lady Lake
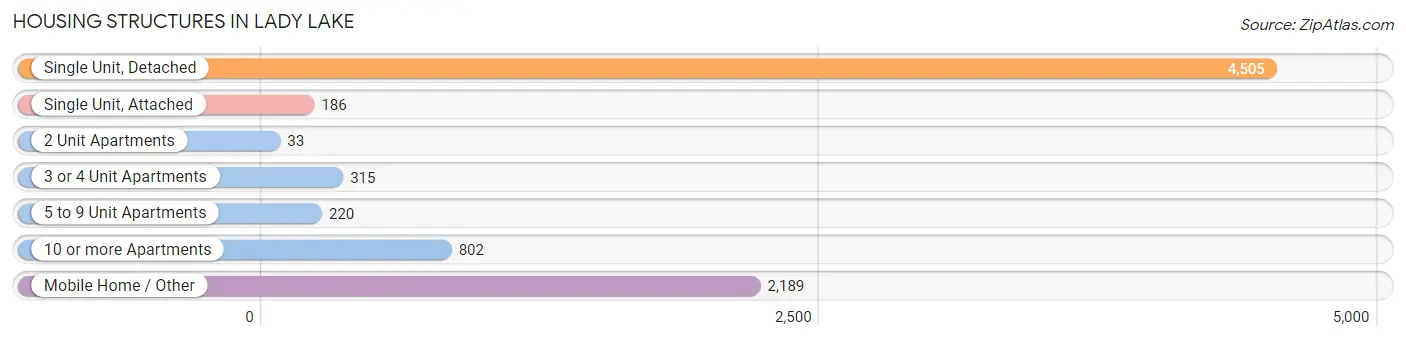
| Structure Type | # Housing Units | % Housing Units |
| Single Unit, Detached | 4,505 | 54.6% |
| Single Unit, Attached | 186 | 2.2% |
| 2 Unit Apartments | 33 | 0.4% |
| 3 or 4 Unit Apartments | 315 | 3.8% |
| 5 to 9 Unit Apartments | 220 | 2.7% |
| 10 or more Apartments | 802 | 9.7% |
| Mobile Home / Other | 2,189 | 26.5% |
| Total | 8,250 | 100.0% |
Housing Structures by Occupancy in Lady Lake
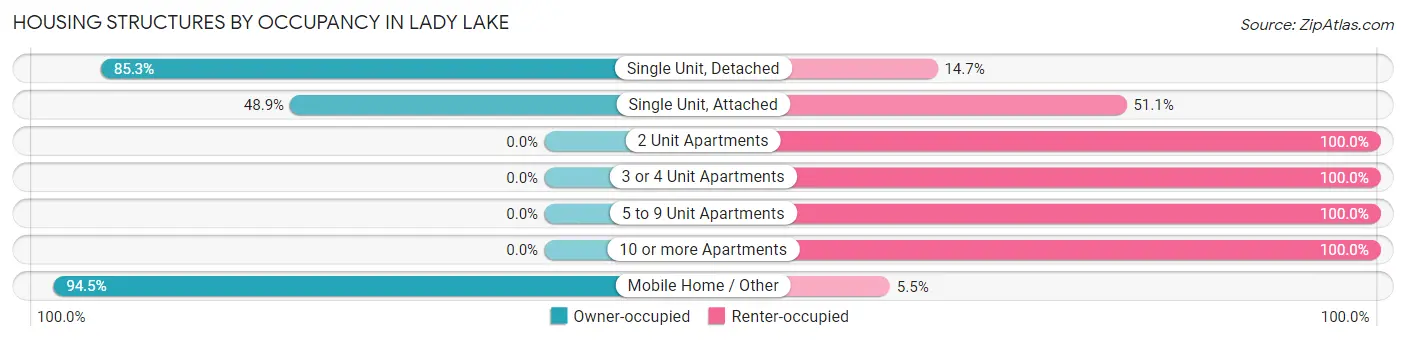
| Structure Type | Owner-occupied | Renter-occupied |
| Single Unit, Detached | 3,843 (85.3%) | 662 (14.7%) |
| Single Unit, Attached | 91 (48.9%) | 95 (51.1%) |
| 2 Unit Apartments | 0 (0.0%) | 33 (100.0%) |
| 3 or 4 Unit Apartments | 0 (0.0%) | 315 (100.0%) |
| 5 to 9 Unit Apartments | 0 (0.0%) | 220 (100.0%) |
| 10 or more Apartments | 0 (0.0%) | 802 (100.0%) |
| Mobile Home / Other | 2,068 (94.5%) | 121 (5.5%) |
| Total | 6,002 (72.8%) | 2,248 (27.3%) |
Housing Structures by Number of Rooms in Lady Lake
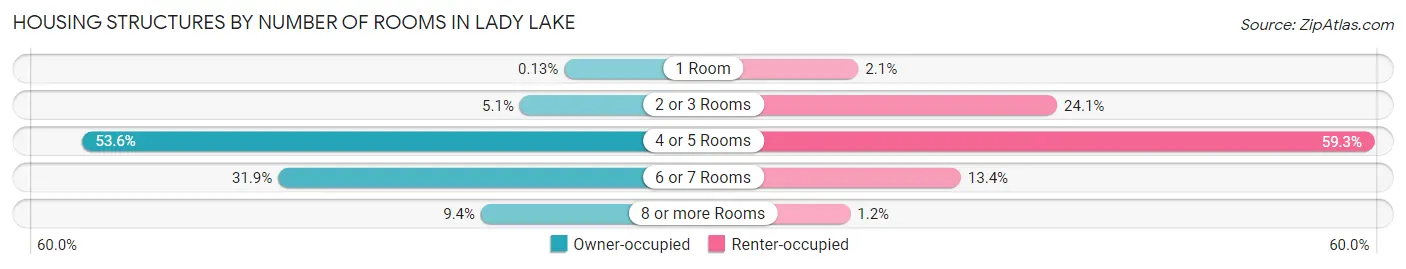
| Number of Rooms | Owner-occupied | Renter-occupied |
| 1 Room | 8 (0.1%) | 46 (2.1%) |
| 2 or 3 Rooms | 303 (5.1%) | 542 (24.1%) |
| 4 or 5 Rooms | 3,216 (53.6%) | 1,332 (59.3%) |
| 6 or 7 Rooms | 1,913 (31.9%) | 302 (13.4%) |
| 8 or more Rooms | 562 (9.4%) | 26 (1.2%) |
| Total | 6,002 (100.0%) | 2,248 (100.0%) |
Housing Structure by Heating Type in Lady Lake
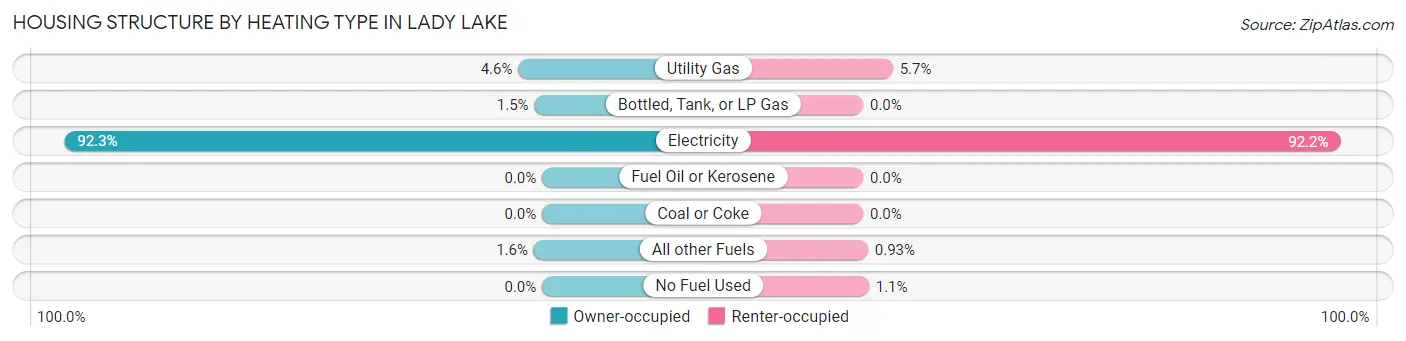
| Heating Type | Owner-occupied | Renter-occupied |
| Utility Gas | 276 (4.6%) | 129 (5.7%) |
| Bottled, Tank, or LP Gas | 89 (1.5%) | 0 (0.0%) |
| Electricity | 5,541 (92.3%) | 2,073 (92.2%) |
| Fuel Oil or Kerosene | 0 (0.0%) | 0 (0.0%) |
| Coal or Coke | 0 (0.0%) | 0 (0.0%) |
| All other Fuels | 96 (1.6%) | 21 (0.9%) |
| No Fuel Used | 0 (0.0%) | 25 (1.1%) |
| Total | 6,002 (100.0%) | 2,248 (100.0%) |
Household Vehicle Usage in Lady Lake
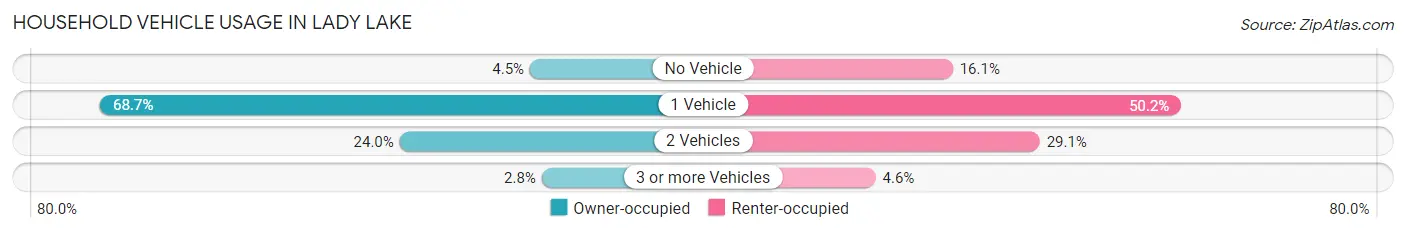
| Vehicles per Household | Owner-occupied | Renter-occupied |
| No Vehicle | 271 (4.5%) | 362 (16.1%) |
| 1 Vehicle | 4,125 (68.7%) | 1,129 (50.2%) |
| 2 Vehicles | 1,440 (24.0%) | 654 (29.1%) |
| 3 or more Vehicles | 166 (2.8%) | 103 (4.6%) |
| Total | 6,002 (100.0%) | 2,248 (100.0%) |
Real Estate & Mortgages in Lady Lake
Real Estate and Mortgage Overview in Lady Lake
| Characteristic | Without Mortgage | With Mortgage |
| Housing Units | 3,453 | 2,549 |
| Median Property Value | $178,900 | $221,100 |
| Median Household Income | $51,532 | $213 |
| Monthly Housing Costs | $511 | $37 |
| Real Estate Taxes | $1,614 | $147 |
Property Value by Mortgage Status in Lady Lake
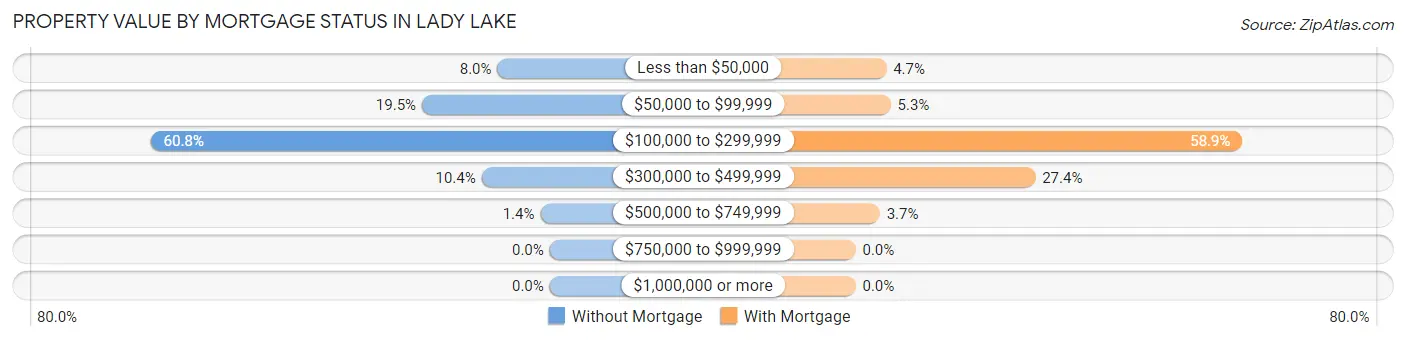
| Property Value | Without Mortgage | With Mortgage |
| Less than $50,000 | 275 (8.0%) | 119 (4.7%) |
| $50,000 to $99,999 | 672 (19.5%) | 136 (5.3%) |
| $100,000 to $299,999 | 2,099 (60.8%) | 1,502 (58.9%) |
| $300,000 to $499,999 | 358 (10.4%) | 698 (27.4%) |
| $500,000 to $749,999 | 49 (1.4%) | 94 (3.7%) |
| $750,000 to $999,999 | 0 (0.0%) | 0 (0.0%) |
| $1,000,000 or more | 0 (0.0%) | 0 (0.0%) |
| Total | 3,453 (100.0%) | 2,549 (100.0%) |
Household Income by Mortgage Status in Lady Lake
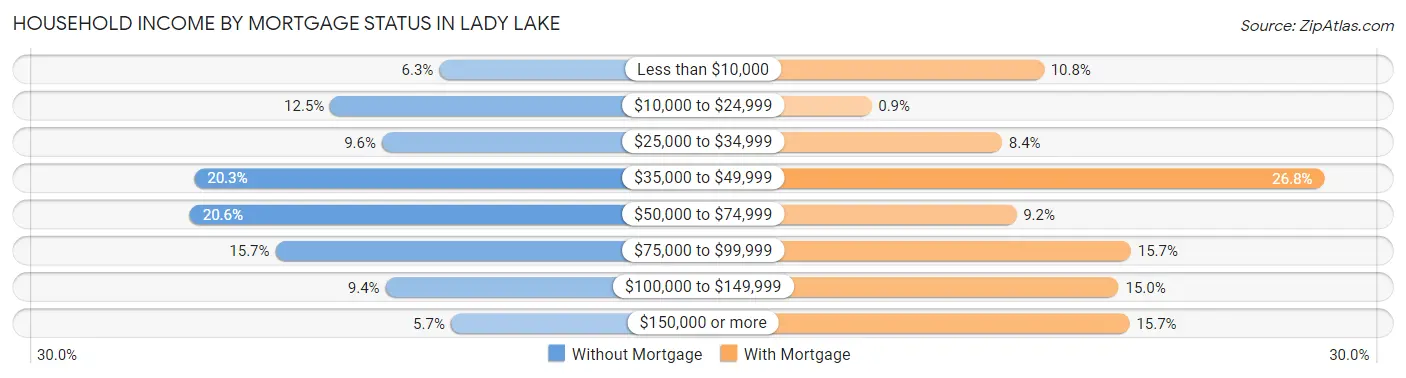
| Household Income | Without Mortgage | With Mortgage |
| Less than $10,000 | 218 (6.3%) | 274 (10.7%) |
| $10,000 to $24,999 | 433 (12.5%) | 23 (0.9%) |
| $25,000 to $34,999 | 331 (9.6%) | 213 (8.4%) |
| $35,000 to $49,999 | 701 (20.3%) | 683 (26.8%) |
| $50,000 to $74,999 | 710 (20.6%) | 234 (9.2%) |
| $75,000 to $99,999 | 541 (15.7%) | 401 (15.7%) |
| $100,000 to $149,999 | 324 (9.4%) | 383 (15.0%) |
| $150,000 or more | 195 (5.7%) | 399 (15.7%) |
| Total | 3,453 (100.0%) | 2,549 (100.0%) |
Property Value to Household Income Ratio in Lady Lake
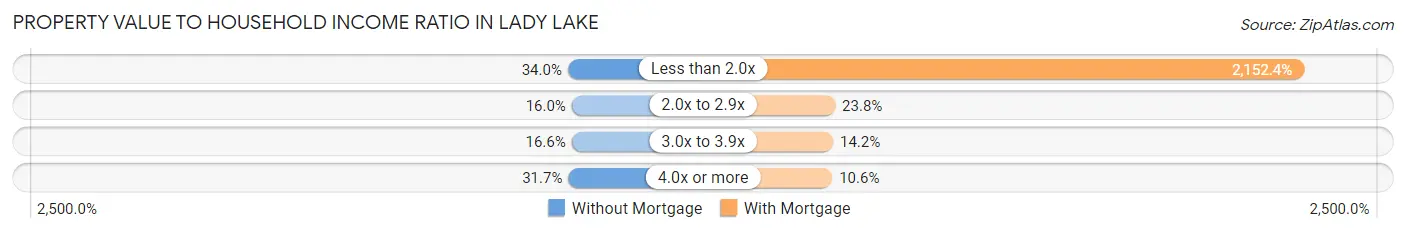
| Value-to-Income Ratio | Without Mortgage | With Mortgage |
| Less than 2.0x | 1,175 (34.0%) | 54,865 (2,152.4%) |
| 2.0x to 2.9x | 554 (16.0%) | 607 (23.8%) |
| 3.0x to 3.9x | 574 (16.6%) | 362 (14.2%) |
| 4.0x or more | 1,095 (31.7%) | 271 (10.6%) |
| Total | 3,453 (100.0%) | 2,549 (100.0%) |
Real Estate Taxes by Mortgage Status in Lady Lake
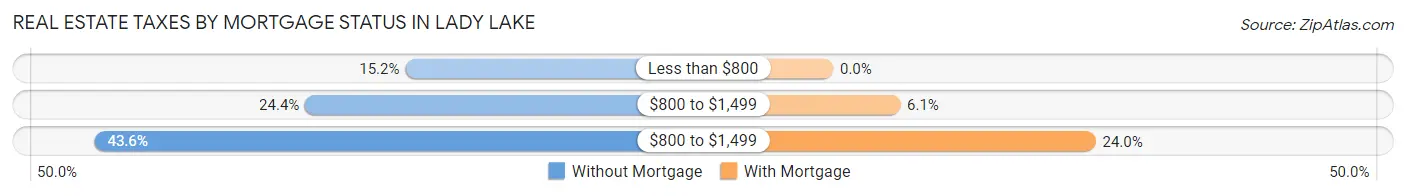
| Property Taxes | Without Mortgage | With Mortgage |
| Less than $800 | 526 (15.2%) | 0 (0.0%) |
| $800 to $1,499 | 842 (24.4%) | 156 (6.1%) |
| $800 to $1,499 | 1,506 (43.6%) | 611 (24.0%) |
| Total | 3,453 (100.0%) | 2,549 (100.0%) |
Health & Disability in Lady Lake
Health Insurance Coverage by Age in Lady Lake

| Age Bracket | With Coverage | Without Coverage |
| Under 6 Years | 373 (91.9%) | 33 (8.1%) |
| 6 to 18 Years | 1,256 (91.1%) | 123 (8.9%) |
| 19 to 25 Years | 672 (77.8%) | 192 (22.2%) |
| 26 to 34 Years | 869 (92.8%) | 67 (7.2%) |
| 35 to 44 Years | 621 (68.2%) | 289 (31.8%) |
| 45 to 54 Years | 716 (81.5%) | 163 (18.5%) |
| 55 to 64 Years | 1,958 (78.7%) | 529 (21.3%) |
| 65 to 74 Years | 3,468 (100.0%) | 0 (0.0%) |
| 75 Years and older | 4,516 (100.0%) | 0 (0.0%) |
| Total | 14,449 (91.2%) | 1,396 (8.8%) |
Health Insurance Coverage by Citizenship Status in Lady Lake
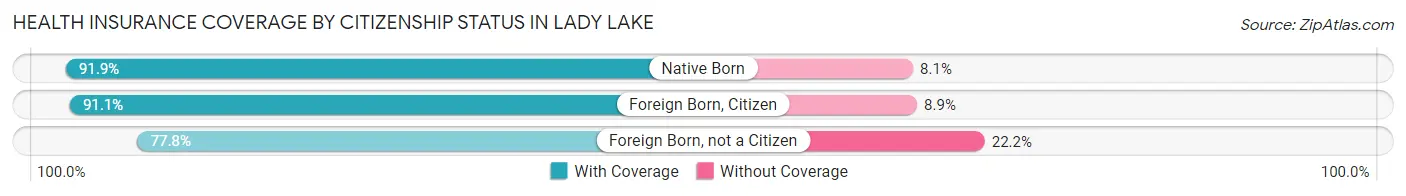
| Citizenship Status | With Coverage | Without Coverage |
| Native Born | 373 (91.9%) | 33 (8.1%) |
| Foreign Born, Citizen | 1,256 (91.1%) | 123 (8.9%) |
| Foreign Born, not a Citizen | 672 (77.8%) | 192 (22.2%) |
Health Insurance Coverage by Household Income in Lady Lake
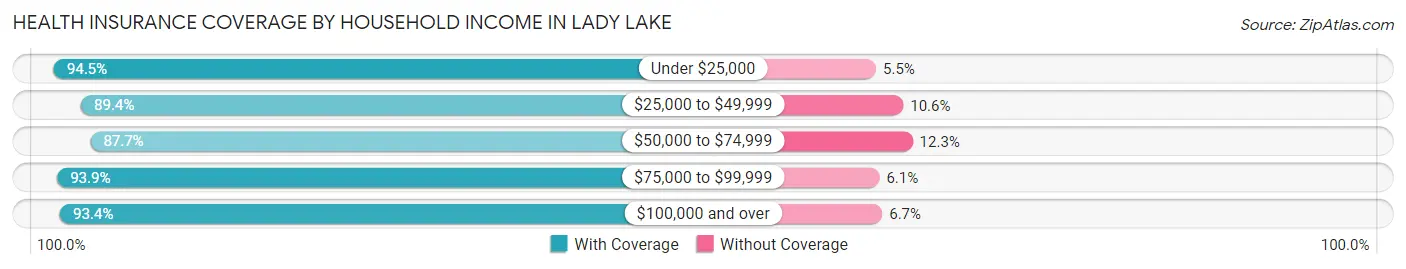
| Household Income | With Coverage | Without Coverage |
| Under $25,000 | 1,979 (94.5%) | 115 (5.5%) |
| $25,000 to $49,999 | 4,890 (89.4%) | 579 (10.6%) |
| $50,000 to $74,999 | 2,543 (87.7%) | 358 (12.3%) |
| $75,000 to $99,999 | 2,209 (93.9%) | 144 (6.1%) |
| $100,000 and over | 2,807 (93.3%) | 200 (6.7%) |
Public vs Private Health Insurance Coverage by Age in Lady Lake
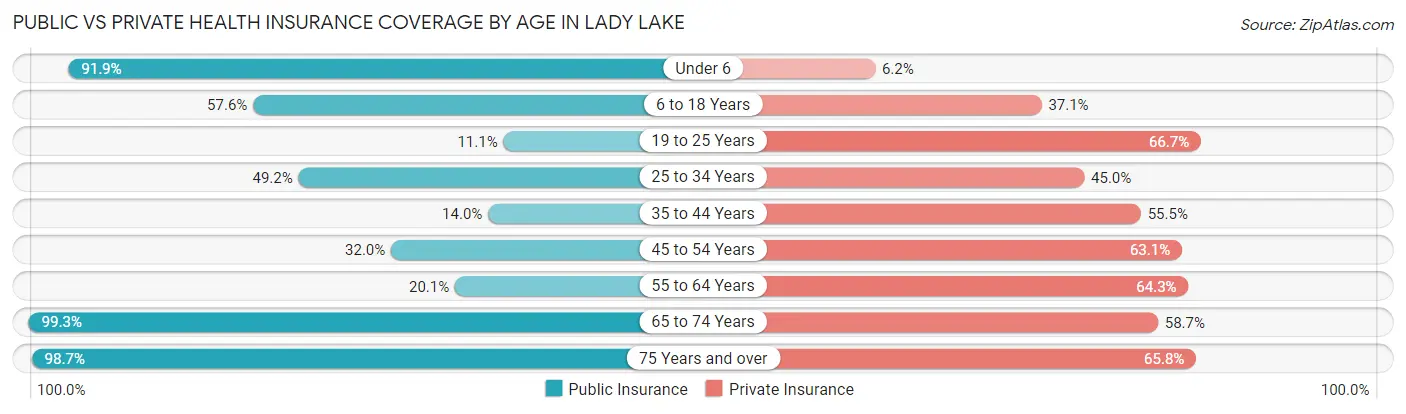
| Age Bracket | Public Insurance | Private Insurance |
| Under 6 | 373 (91.9%) | 25 (6.2%) |
| 6 to 18 Years | 794 (57.6%) | 511 (37.1%) |
| 19 to 25 Years | 96 (11.1%) | 576 (66.7%) |
| 25 to 34 Years | 460 (49.1%) | 421 (45.0%) |
| 35 to 44 Years | 127 (14.0%) | 505 (55.5%) |
| 45 to 54 Years | 281 (32.0%) | 555 (63.1%) |
| 55 to 64 Years | 500 (20.1%) | 1,600 (64.3%) |
| 65 to 74 Years | 3,442 (99.3%) | 2,034 (58.7%) |
| 75 Years and over | 4,457 (98.7%) | 2,970 (65.8%) |
| Total | 10,530 (66.5%) | 9,197 (58.0%) |
Disability Status by Sex by Age in Lady Lake
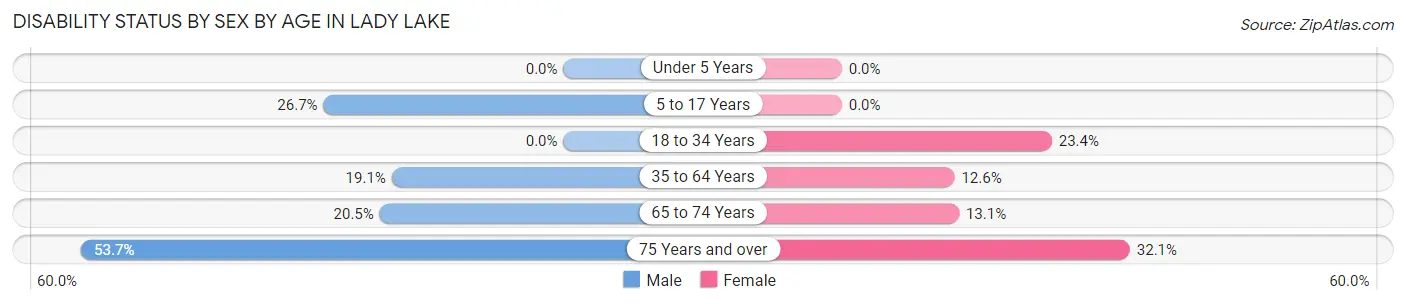
| Age Bracket | Male | Female |
| Under 5 Years | 0 (0.0%) | 0 (0.0%) |
| 5 to 17 Years | 155 (26.7%) | 0 (0.0%) |
| 18 to 34 Years | 0 (0.0%) | 290 (23.4%) |
| 35 to 64 Years | 379 (19.1%) | 288 (12.6%) |
| 65 to 74 Years | 313 (20.5%) | 253 (13.1%) |
| 75 Years and over | 1,225 (53.7%) | 717 (32.1%) |
Disability Class by Sex by Age in Lady Lake
Disability Class: Hearing Difficulty
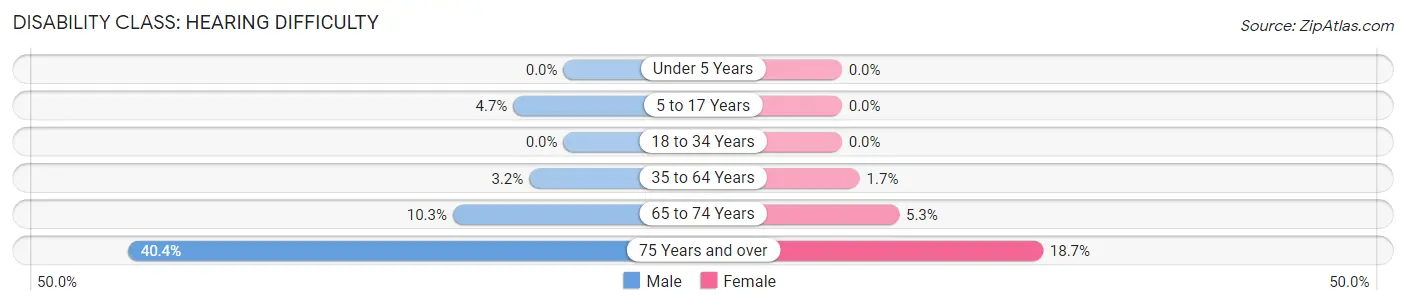
| Age Bracket | Male | Female |
| Under 5 Years | 0 (0.0%) | 0 (0.0%) |
| 5 to 17 Years | 27 (4.7%) | 0 (0.0%) |
| 18 to 34 Years | 0 (0.0%) | 0 (0.0%) |
| 35 to 64 Years | 63 (3.2%) | 38 (1.7%) |
| 65 to 74 Years | 157 (10.3%) | 103 (5.3%) |
| 75 Years and over | 922 (40.4%) | 417 (18.7%) |
Disability Class: Vision Difficulty
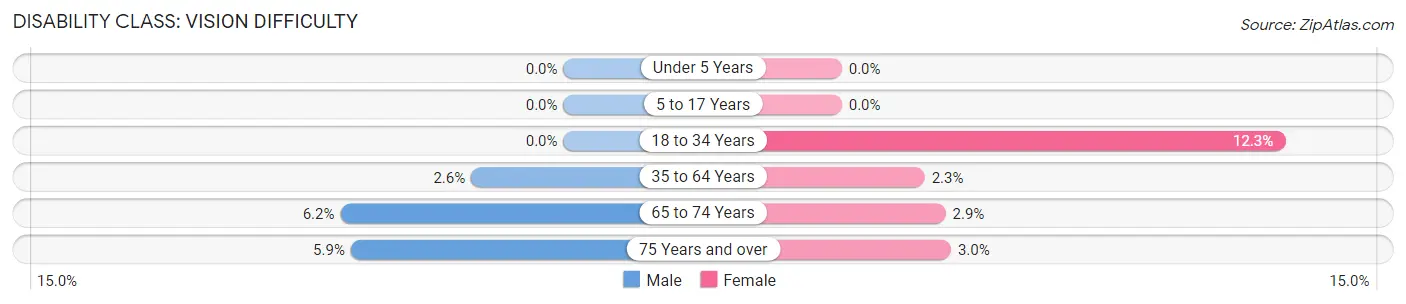
| Age Bracket | Male | Female |
| Under 5 Years | 0 (0.0%) | 0 (0.0%) |
| 5 to 17 Years | 0 (0.0%) | 0 (0.0%) |
| 18 to 34 Years | 0 (0.0%) | 153 (12.3%) |
| 35 to 64 Years | 51 (2.6%) | 53 (2.3%) |
| 65 to 74 Years | 95 (6.2%) | 56 (2.9%) |
| 75 Years and over | 135 (5.9%) | 68 (3.0%) |
Disability Class: Cognitive Difficulty
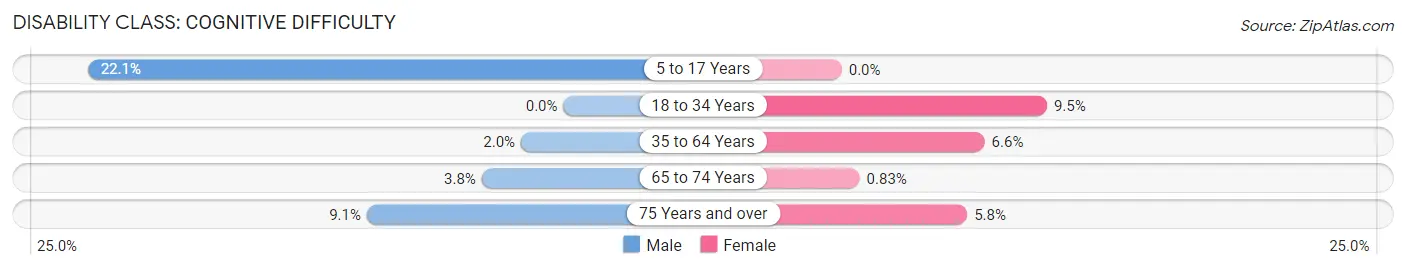
| Age Bracket | Male | Female |
| 5 to 17 Years | 128 (22.1%) | 0 (0.0%) |
| 18 to 34 Years | 0 (0.0%) | 118 (9.5%) |
| 35 to 64 Years | 39 (2.0%) | 152 (6.6%) |
| 65 to 74 Years | 58 (3.8%) | 16 (0.8%) |
| 75 Years and over | 208 (9.1%) | 130 (5.8%) |
Disability Class: Ambulatory Difficulty
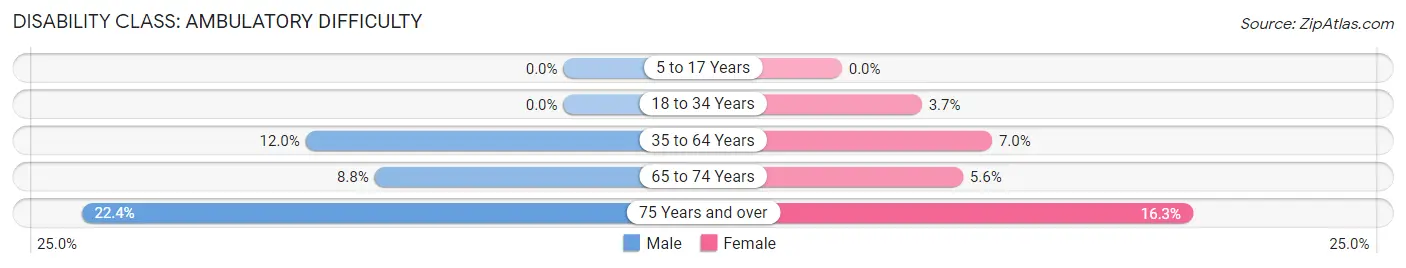
| Age Bracket | Male | Female |
| 5 to 17 Years | 0 (0.0%) | 0 (0.0%) |
| 18 to 34 Years | 0 (0.0%) | 46 (3.7%) |
| 35 to 64 Years | 237 (12.0%) | 160 (7.0%) |
| 65 to 74 Years | 134 (8.8%) | 109 (5.6%) |
| 75 Years and over | 510 (22.4%) | 364 (16.3%) |
Disability Class: Self-Care Difficulty
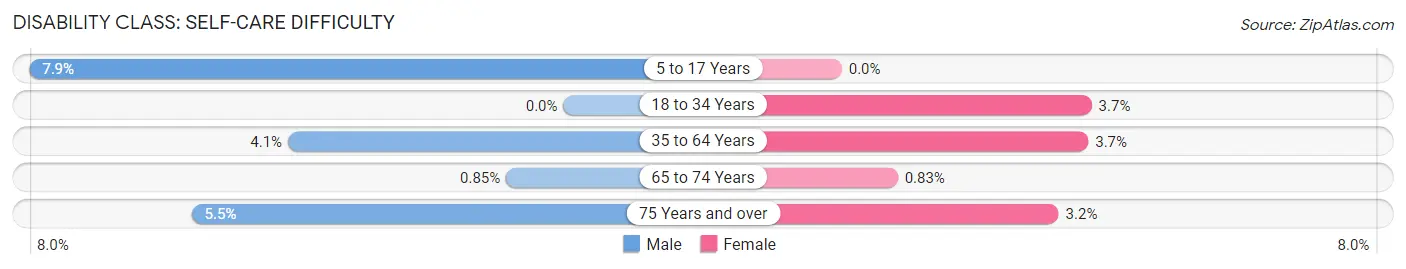
| Age Bracket | Male | Female |
| 5 to 17 Years | 46 (7.9%) | 0 (0.0%) |
| 18 to 34 Years | 0 (0.0%) | 46 (3.7%) |
| 35 to 64 Years | 81 (4.1%) | 84 (3.7%) |
| 65 to 74 Years | 13 (0.9%) | 16 (0.8%) |
| 75 Years and over | 126 (5.5%) | 72 (3.2%) |
Technology Access in Lady Lake
Computing Device Access in Lady Lake
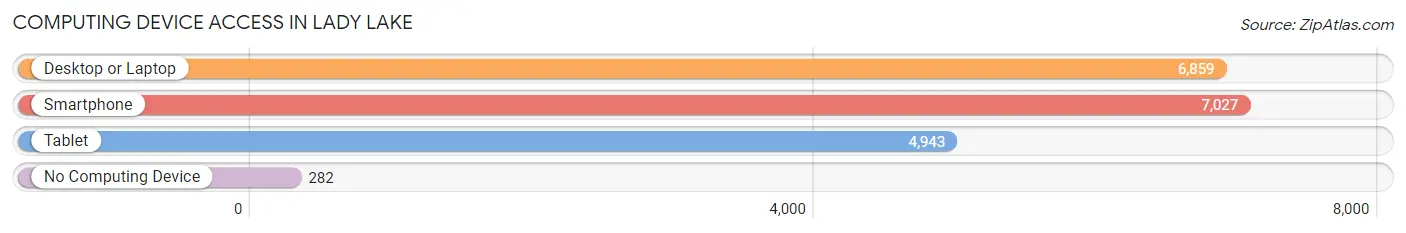
| Device Type | # Households | % Households |
| Desktop or Laptop | 6,859 | 83.1% |
| Smartphone | 7,027 | 85.2% |
| Tablet | 4,943 | 59.9% |
| No Computing Device | 282 | 3.4% |
| Total | 8,250 | 100.0% |
Internet Access in Lady Lake
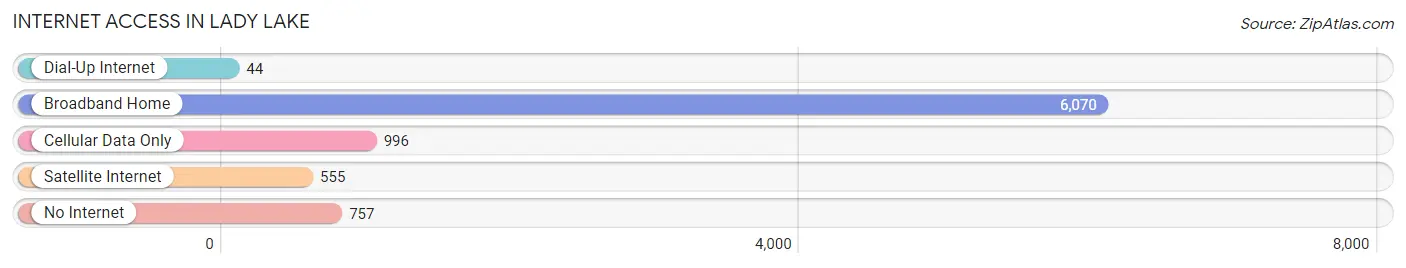
| Internet Type | # Households | % Households |
| Dial-Up Internet | 44 | 0.5% |
| Broadband Home | 6,070 | 73.6% |
| Cellular Data Only | 996 | 12.1% |
| Satellite Internet | 555 | 6.7% |
| No Internet | 757 | 9.2% |
| Total | 8,250 | 100.0% |
Lady Lake Summary
History
Lady Lake is a town located in Lake County, Florida. It is part of the Orlando-Kissimmee-Sanford Metropolitan Statistical Area. The town was founded in 1883 by a group of settlers from Georgia and was originally known as Allendale. The town was renamed Lady Lake in 1925 after the wife of one of the original settlers.
Lady Lake was a small farming community until the 1950s when it began to experience rapid growth due to the development of The Villages, a large retirement community located nearby. The town has since become a popular destination for retirees and is now home to a variety of businesses, restaurants, and other attractions.
Geography
Lady Lake is located in central Florida, approximately 25 miles northwest of Orlando. The town is situated on the western shore of Lake Griffin, a large lake that is part of the Harris Chain of Lakes. The town is bordered by the cities of Fruitland Park to the north, Leesburg to the east, and The Villages to the south.
The town has a total area of 8.2 square miles, of which 7.9 square miles is land and 0.3 square miles is water. The terrain is mostly flat, with some rolling hills in the northern part of the town. The climate is humid subtropical, with hot, humid summers and mild winters.
Economy
Lady Lake’s economy is largely driven by tourism and retirement. The town is home to a variety of businesses, restaurants, and other attractions, including the Lady Lake Golf Course, the Lady Lake Historical Museum, and the Lady Lake Public Library.
The town is also home to several large employers, including the Villages Regional Hospital, the Villages Regional Medical Center, and the Villages Regional Medical Center. Additionally, the town is home to several manufacturing and distribution companies, including the Lady Lake Manufacturing Company and the Lady Lake Distribution Center.
Demographics
As of the 2010 census, Lady Lake had a population of 11,828. The racial makeup of the town was 87.3% White, 8.2% African American, 0.7% Native American, 0.7% Asian, 0.1% Pacific Islander, 1.3% from other races, and 1.9% from two or more races. Hispanic or Latino of any race were 5.2% of the population.
The median income for a household in the town was $41,945, and the median income for a family was $50,945. The per capita income for the town was $22,845. About 8.3% of families and 10.2% of the population were below the poverty line, including 14.2% of those under age 18 and 6.2% of those age 65 or over.
Common Questions
What is Per Capita Income in Lady Lake?
Per Capita income in Lady Lake is $32,383.
What is the Median Family Income in Lady Lake?
Median Family Income in Lady Lake is $62,027.
What is the Median Household income in Lady Lake?
Median Household Income in Lady Lake is $46,694.
What is Income or Wage Gap in Lady Lake?
Income or Wage Gap in Lady Lake is 37.6%.
Women in Lady Lake earn 62.4 cents for every dollar earned by a man.
What is Family Income Deficit in Lady Lake?
Family Income Deficit in Lady Lake is $19,006.
Families that are below poverty line in Lady Lake earn $19,006 less on average than the poverty threshold level.
What is Inequality or Gini Index in Lady Lake?
Inequality or Gini Index in Lady Lake is 0.40.
What is the Total Population of Lady Lake?
Total Population of Lady Lake is 16,047.
What is the Total Male Population of Lady Lake?
Total Male Population of Lady Lake is 7,371.
What is the Total Female Population of Lady Lake?
Total Female Population of Lady Lake is 8,676.
What is the Ratio of Males per 100 Females in Lady Lake?
There are 84.96 Males per 100 Females in Lady Lake.
What is the Ratio of Females per 100 Males in Lady Lake?
There are 117.70 Females per 100 Males in Lady Lake.
What is the Median Population Age in Lady Lake?
Median Population Age in Lady Lake is 65.5 Years.
What is the Average Family Size in Lady Lake
Average Family Size in Lady Lake is 2.4 People.
What is the Average Household Size in Lady Lake
Average Household Size in Lady Lake is 1.9 People.
How Large is the Labor Force in Lady Lake?
There are 5,099 People in the Labor Forcein in Lady Lake.
What is the Percentage of People in the Labor Force in Lady Lake?
35.1% of People are in the Labor Force in Lady Lake.
What is the Unemployment Rate in Lady Lake?
Unemployment Rate in Lady Lake is 7.7%.